About
Network Inventory with Network Maps in Web and Visio Toolbox
Codima Network Inventory with
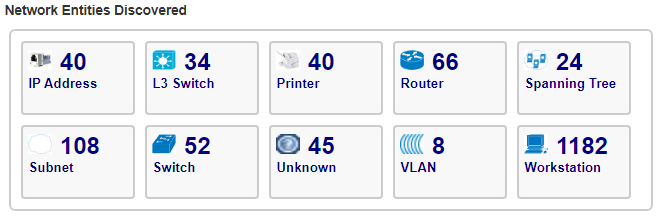
Network Maps in Web and Visio Toolbox is an Agentless Network Discovery tool that acts as a Hardware and Software Inventory System as well as Hardware Asset Management Software.
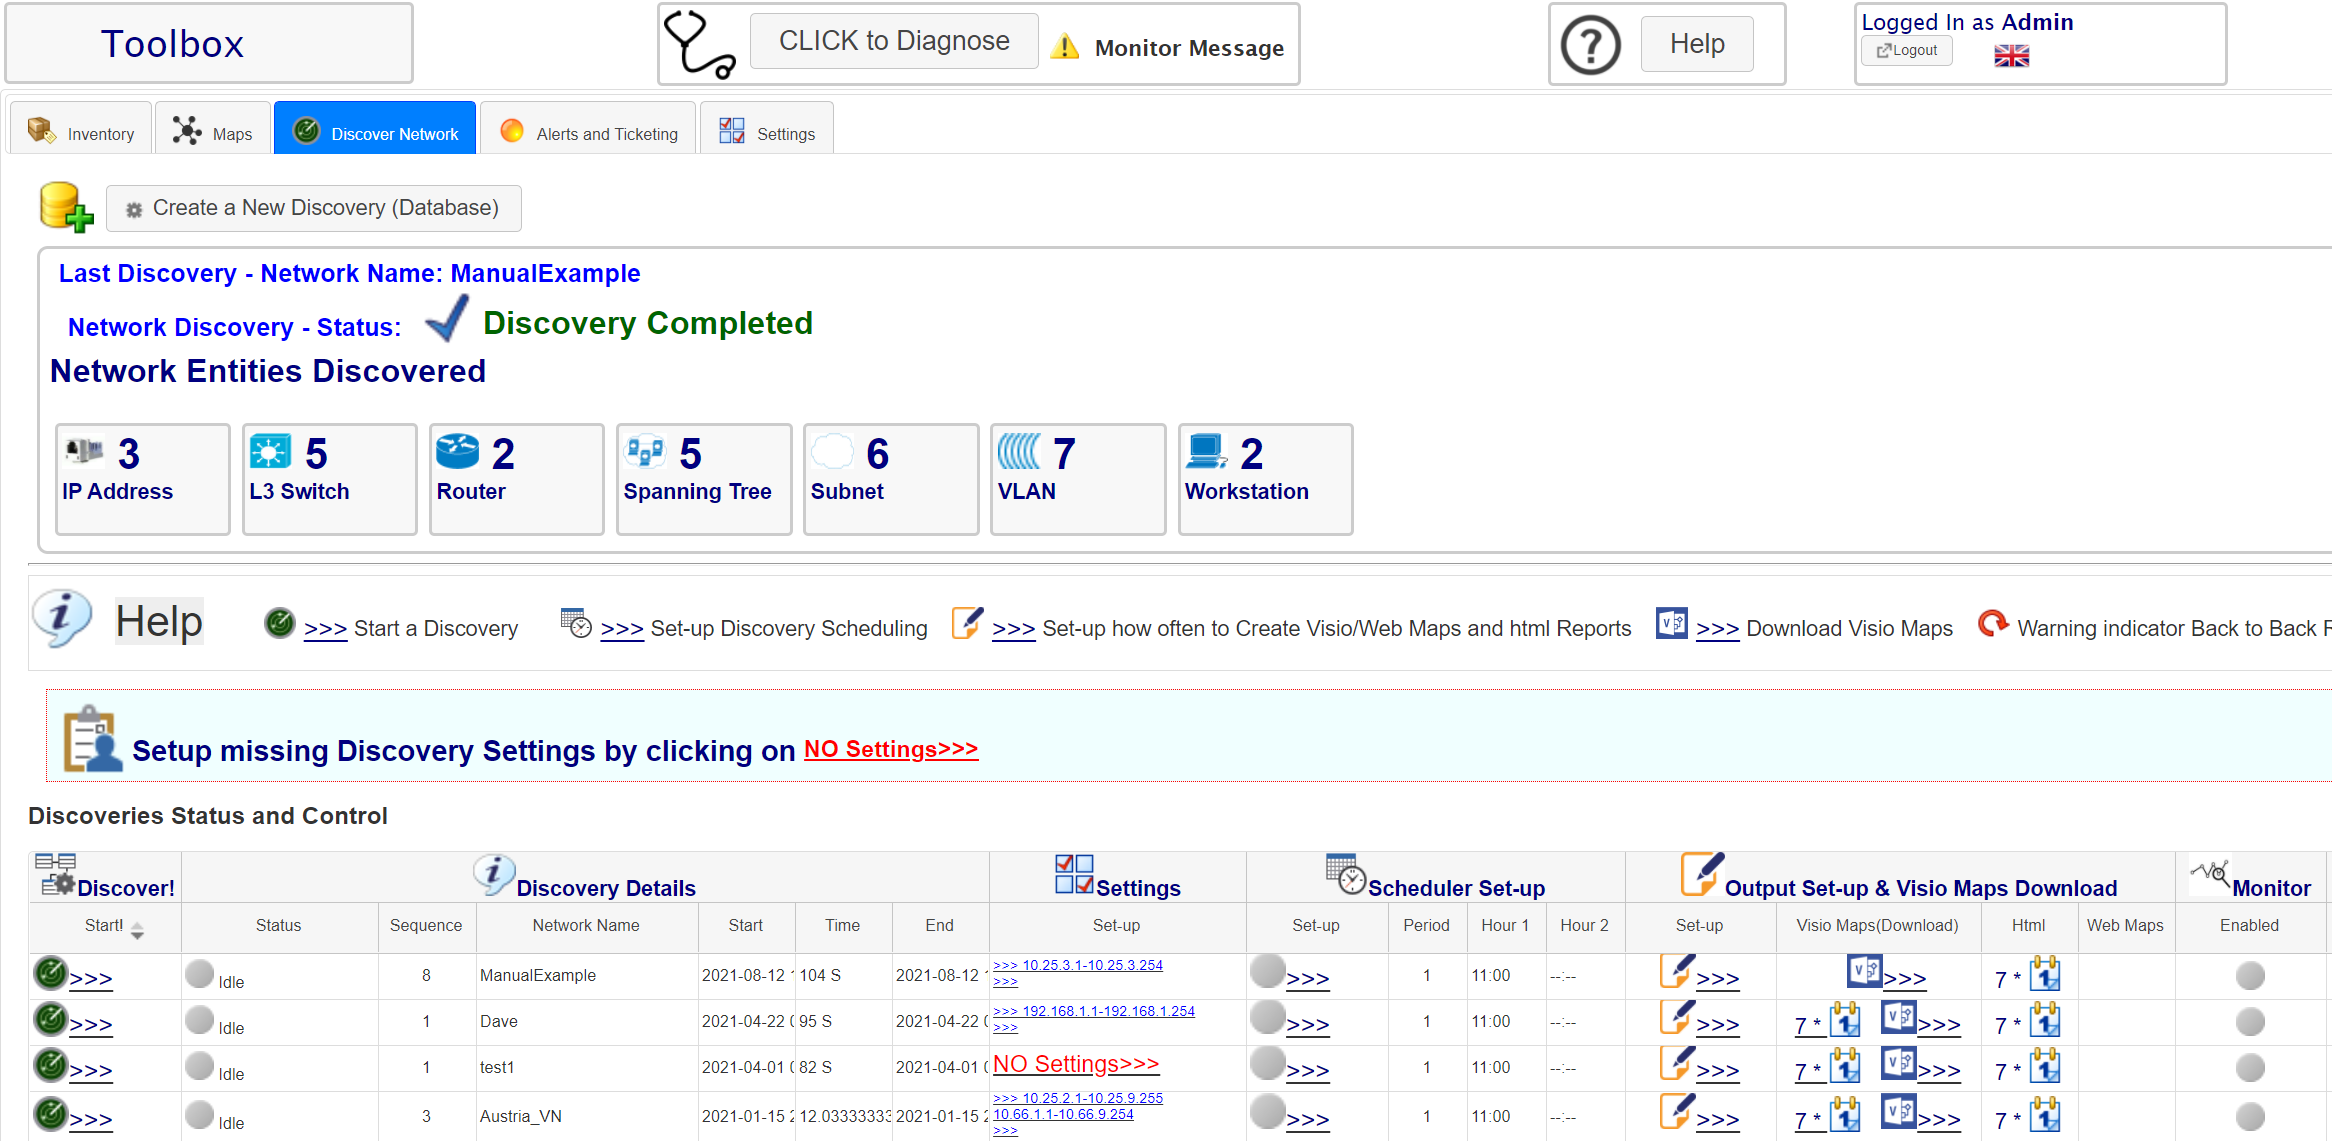
The Toolbox GUI is very compact with no complex menu drill downs. A layered tabbed structure automatically organises Asset views. The Toolbox is ready to go directly following a Network Discovery with no extra configuration necessary.
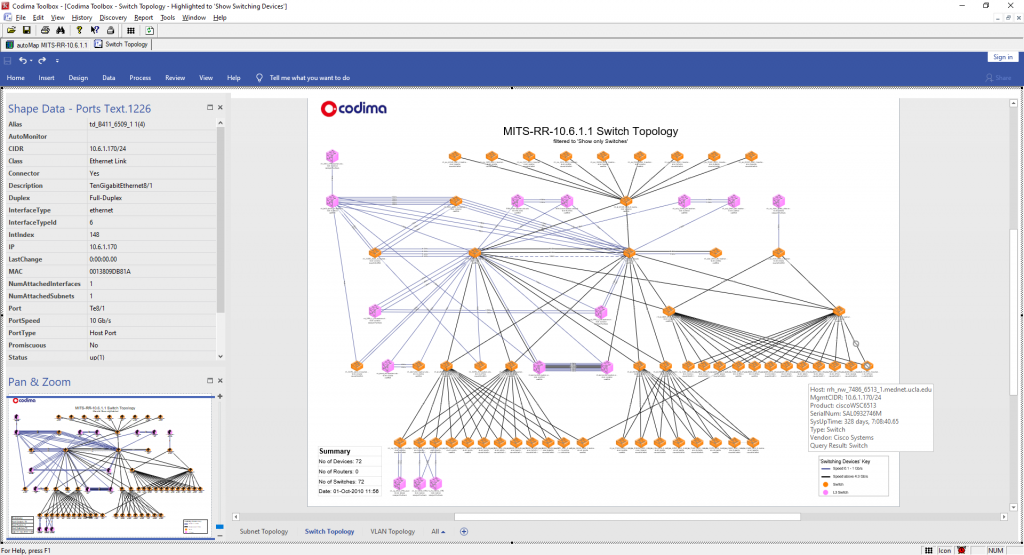
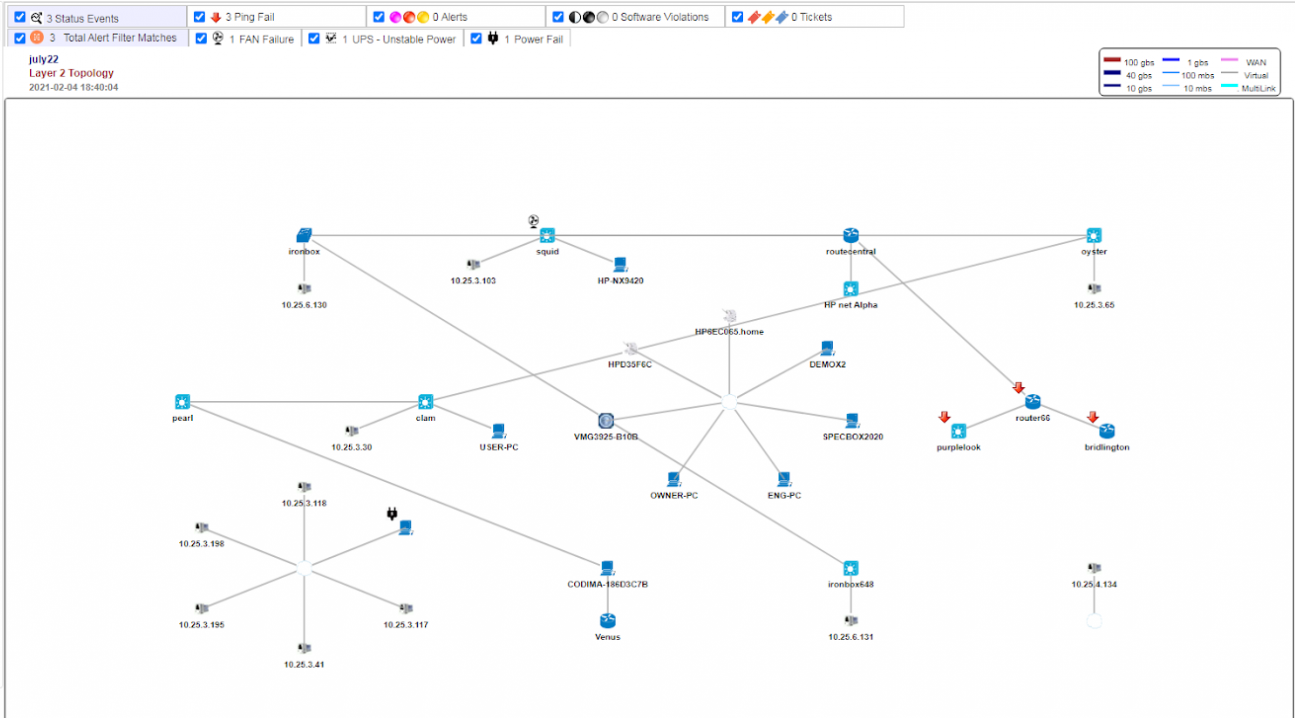
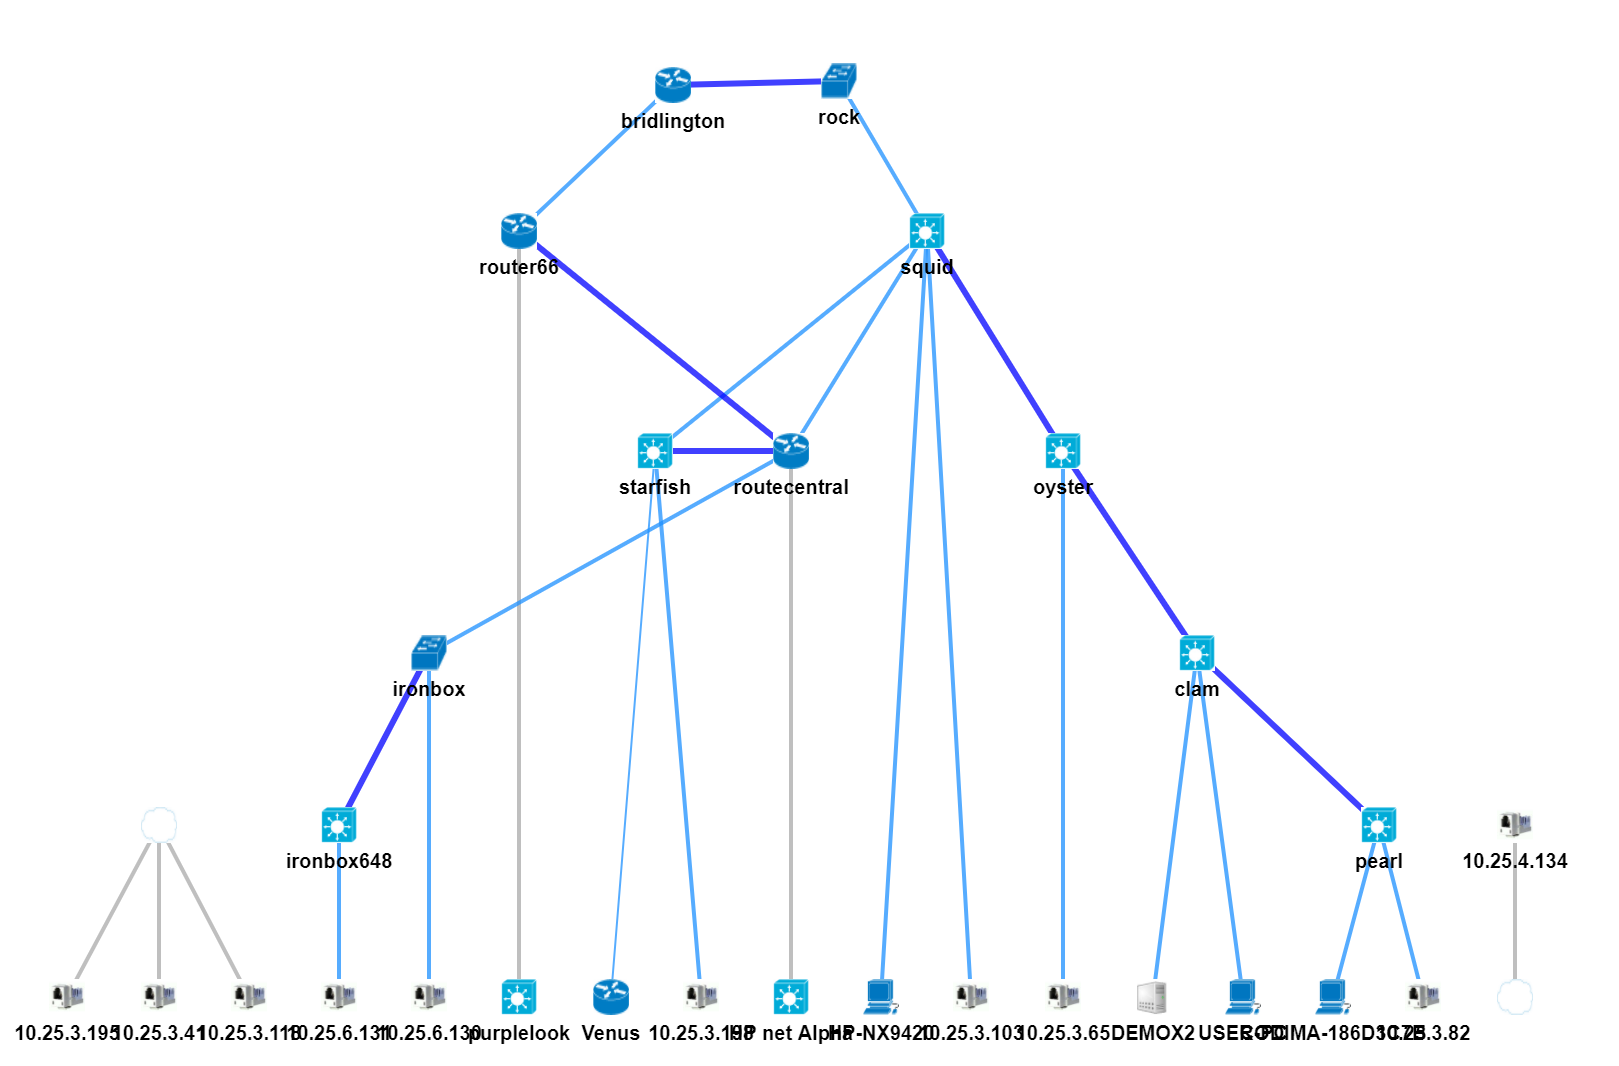
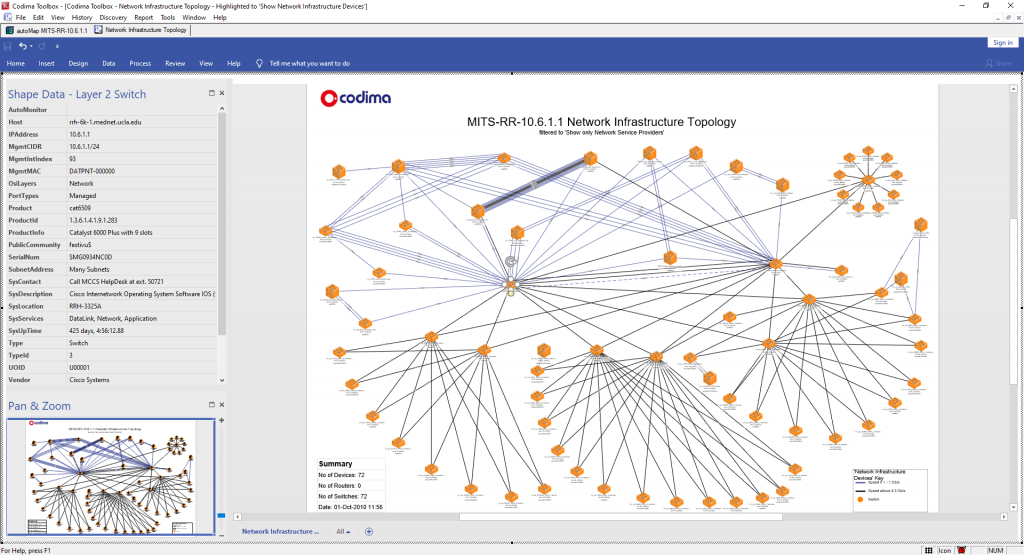
Each Discovery can be viewed in Web and Visio Maps for any topology with any type of environment. Whether it is wired, wireless, or virtual, Codima Toolbox will automatically generate the maps you need to “see” on your network.
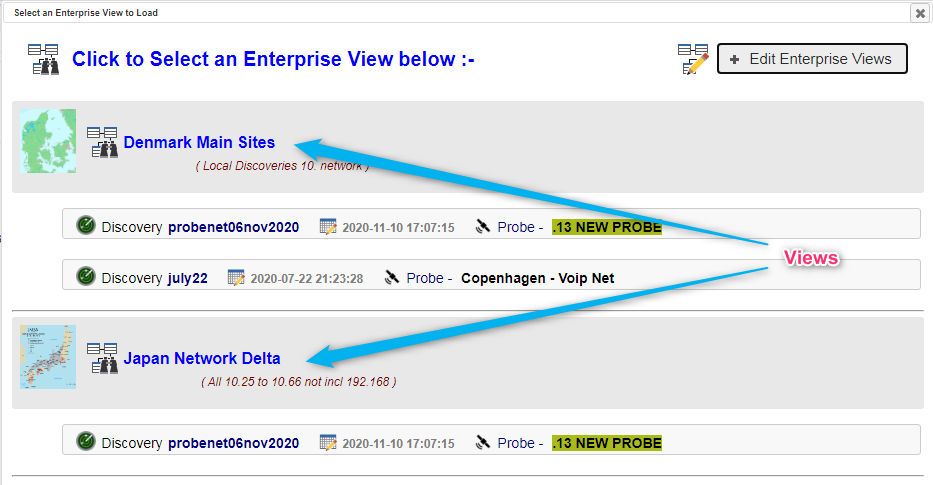
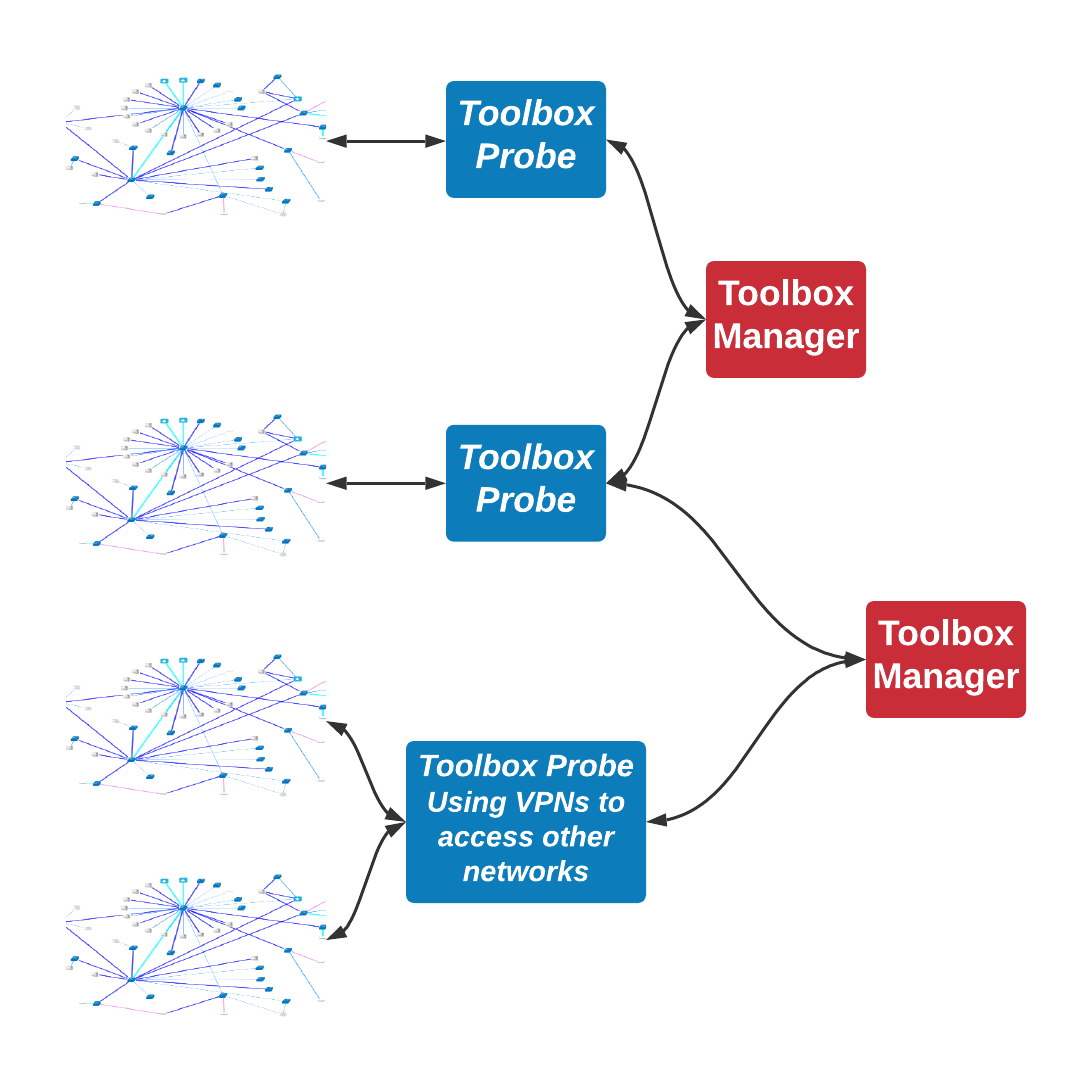
The scalability has no limit as using Probes. Each Probe runs in parallel to any request.
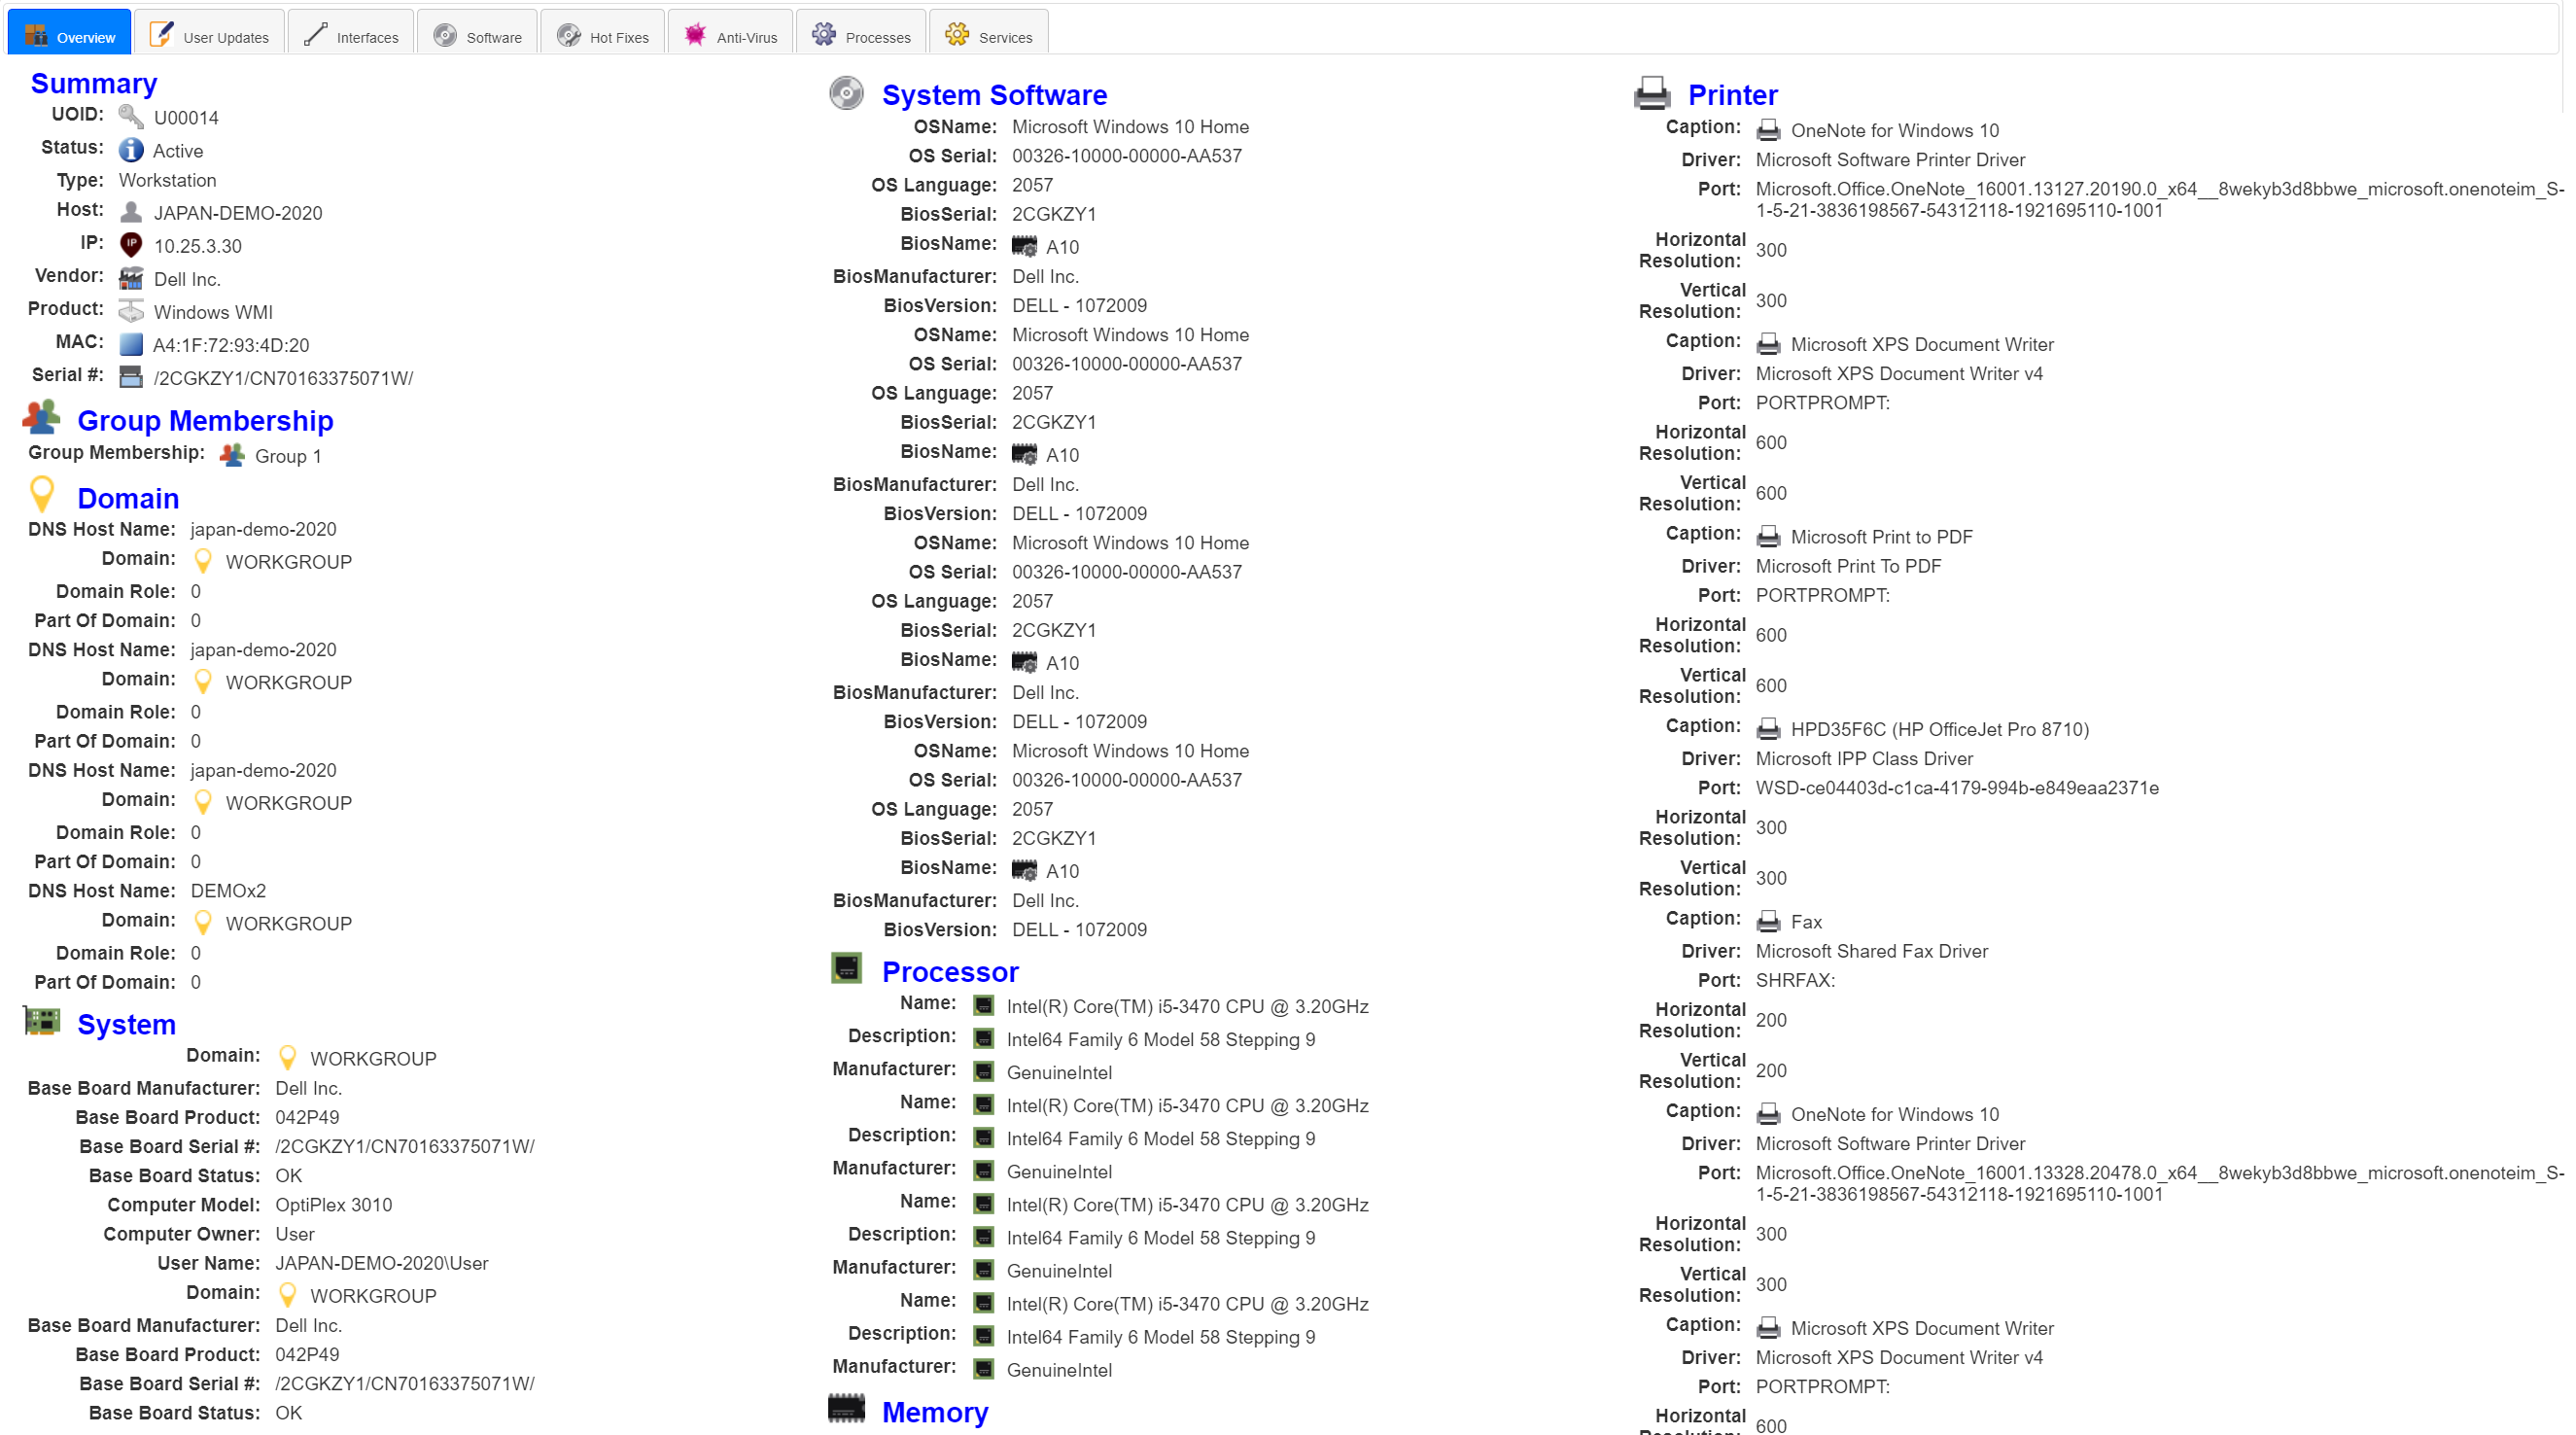
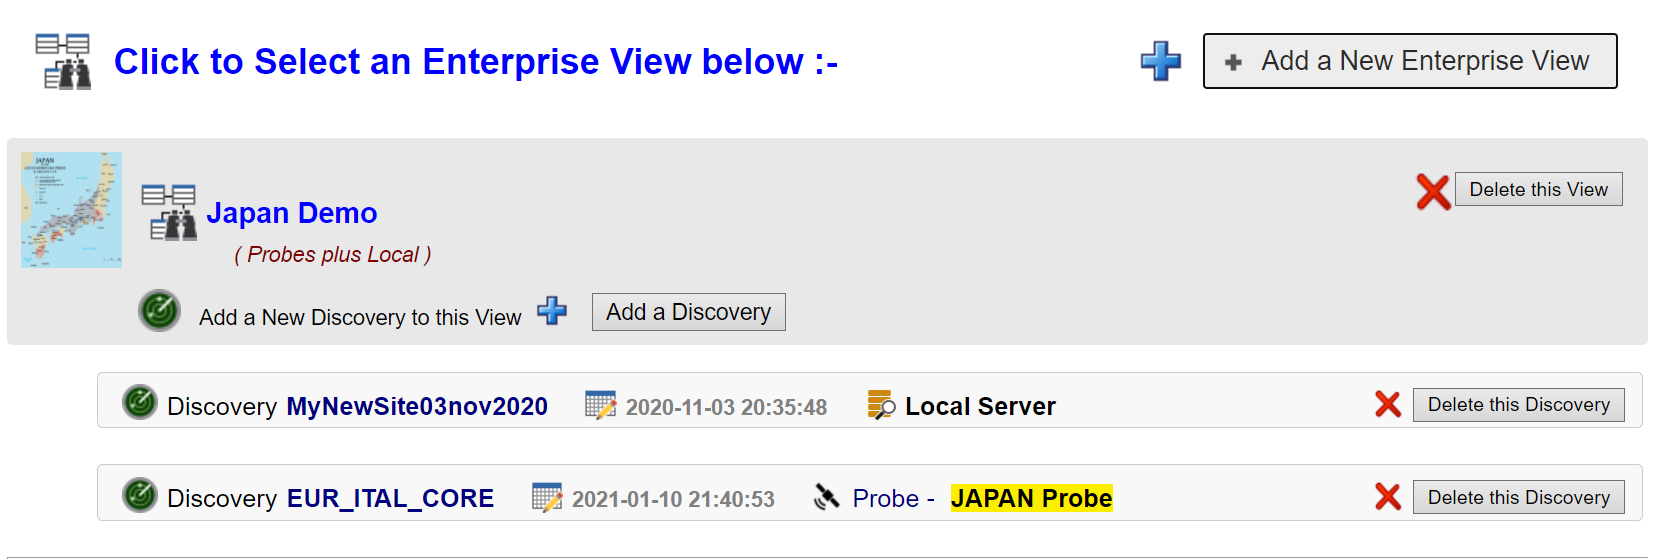
The ITIL information is available through Enterprise View.
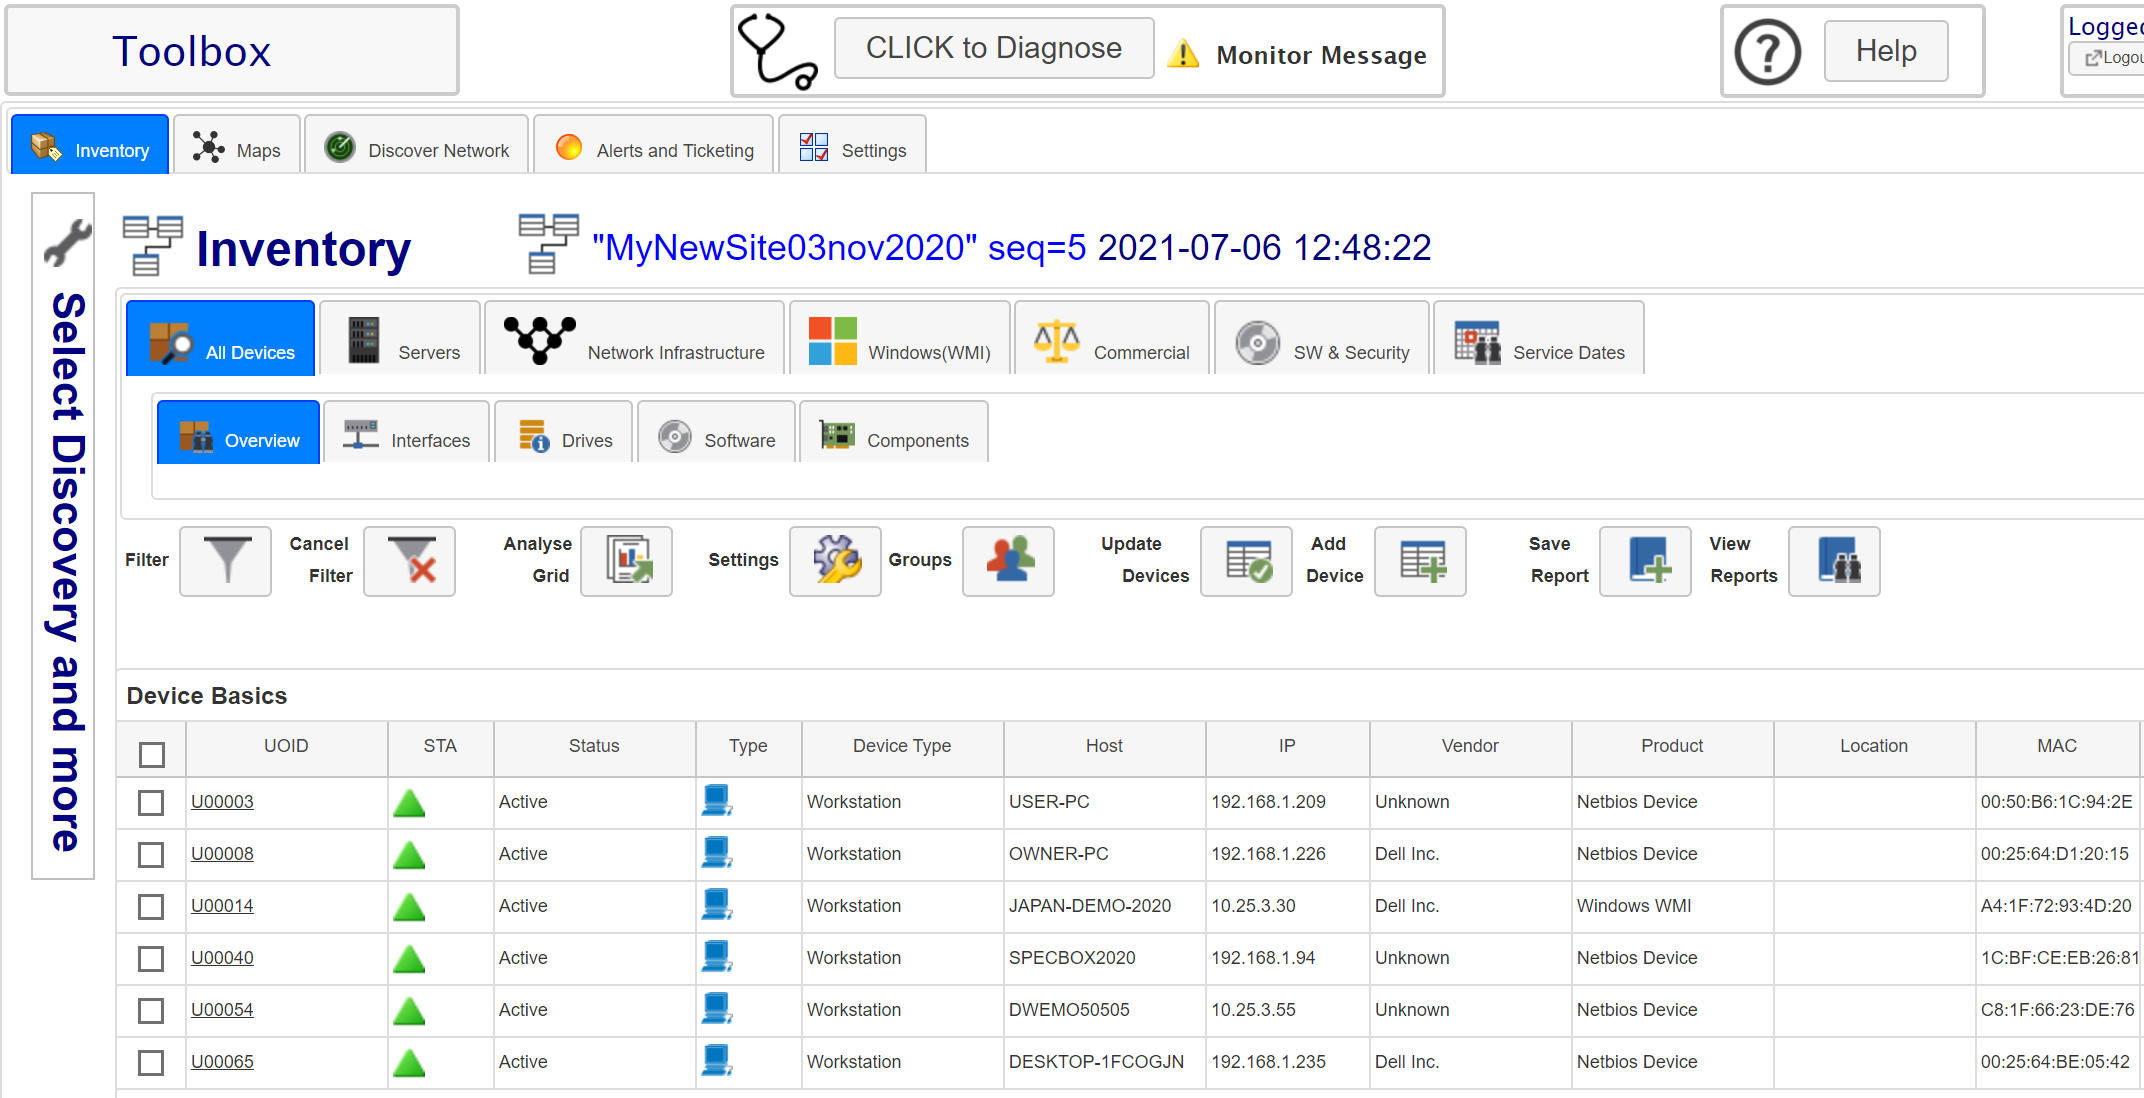
The Toolbox documents and enables deep exploration of the MySQL asset dbase using a consistent and compact interface that makes the product easy to use. It primarily uses the dbase created by a Network Discovery, the
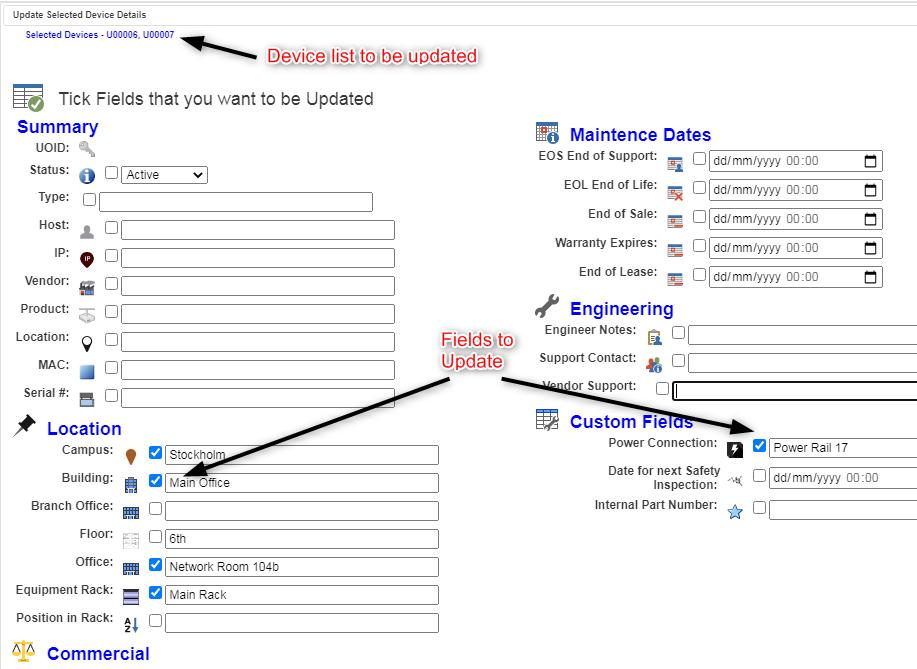
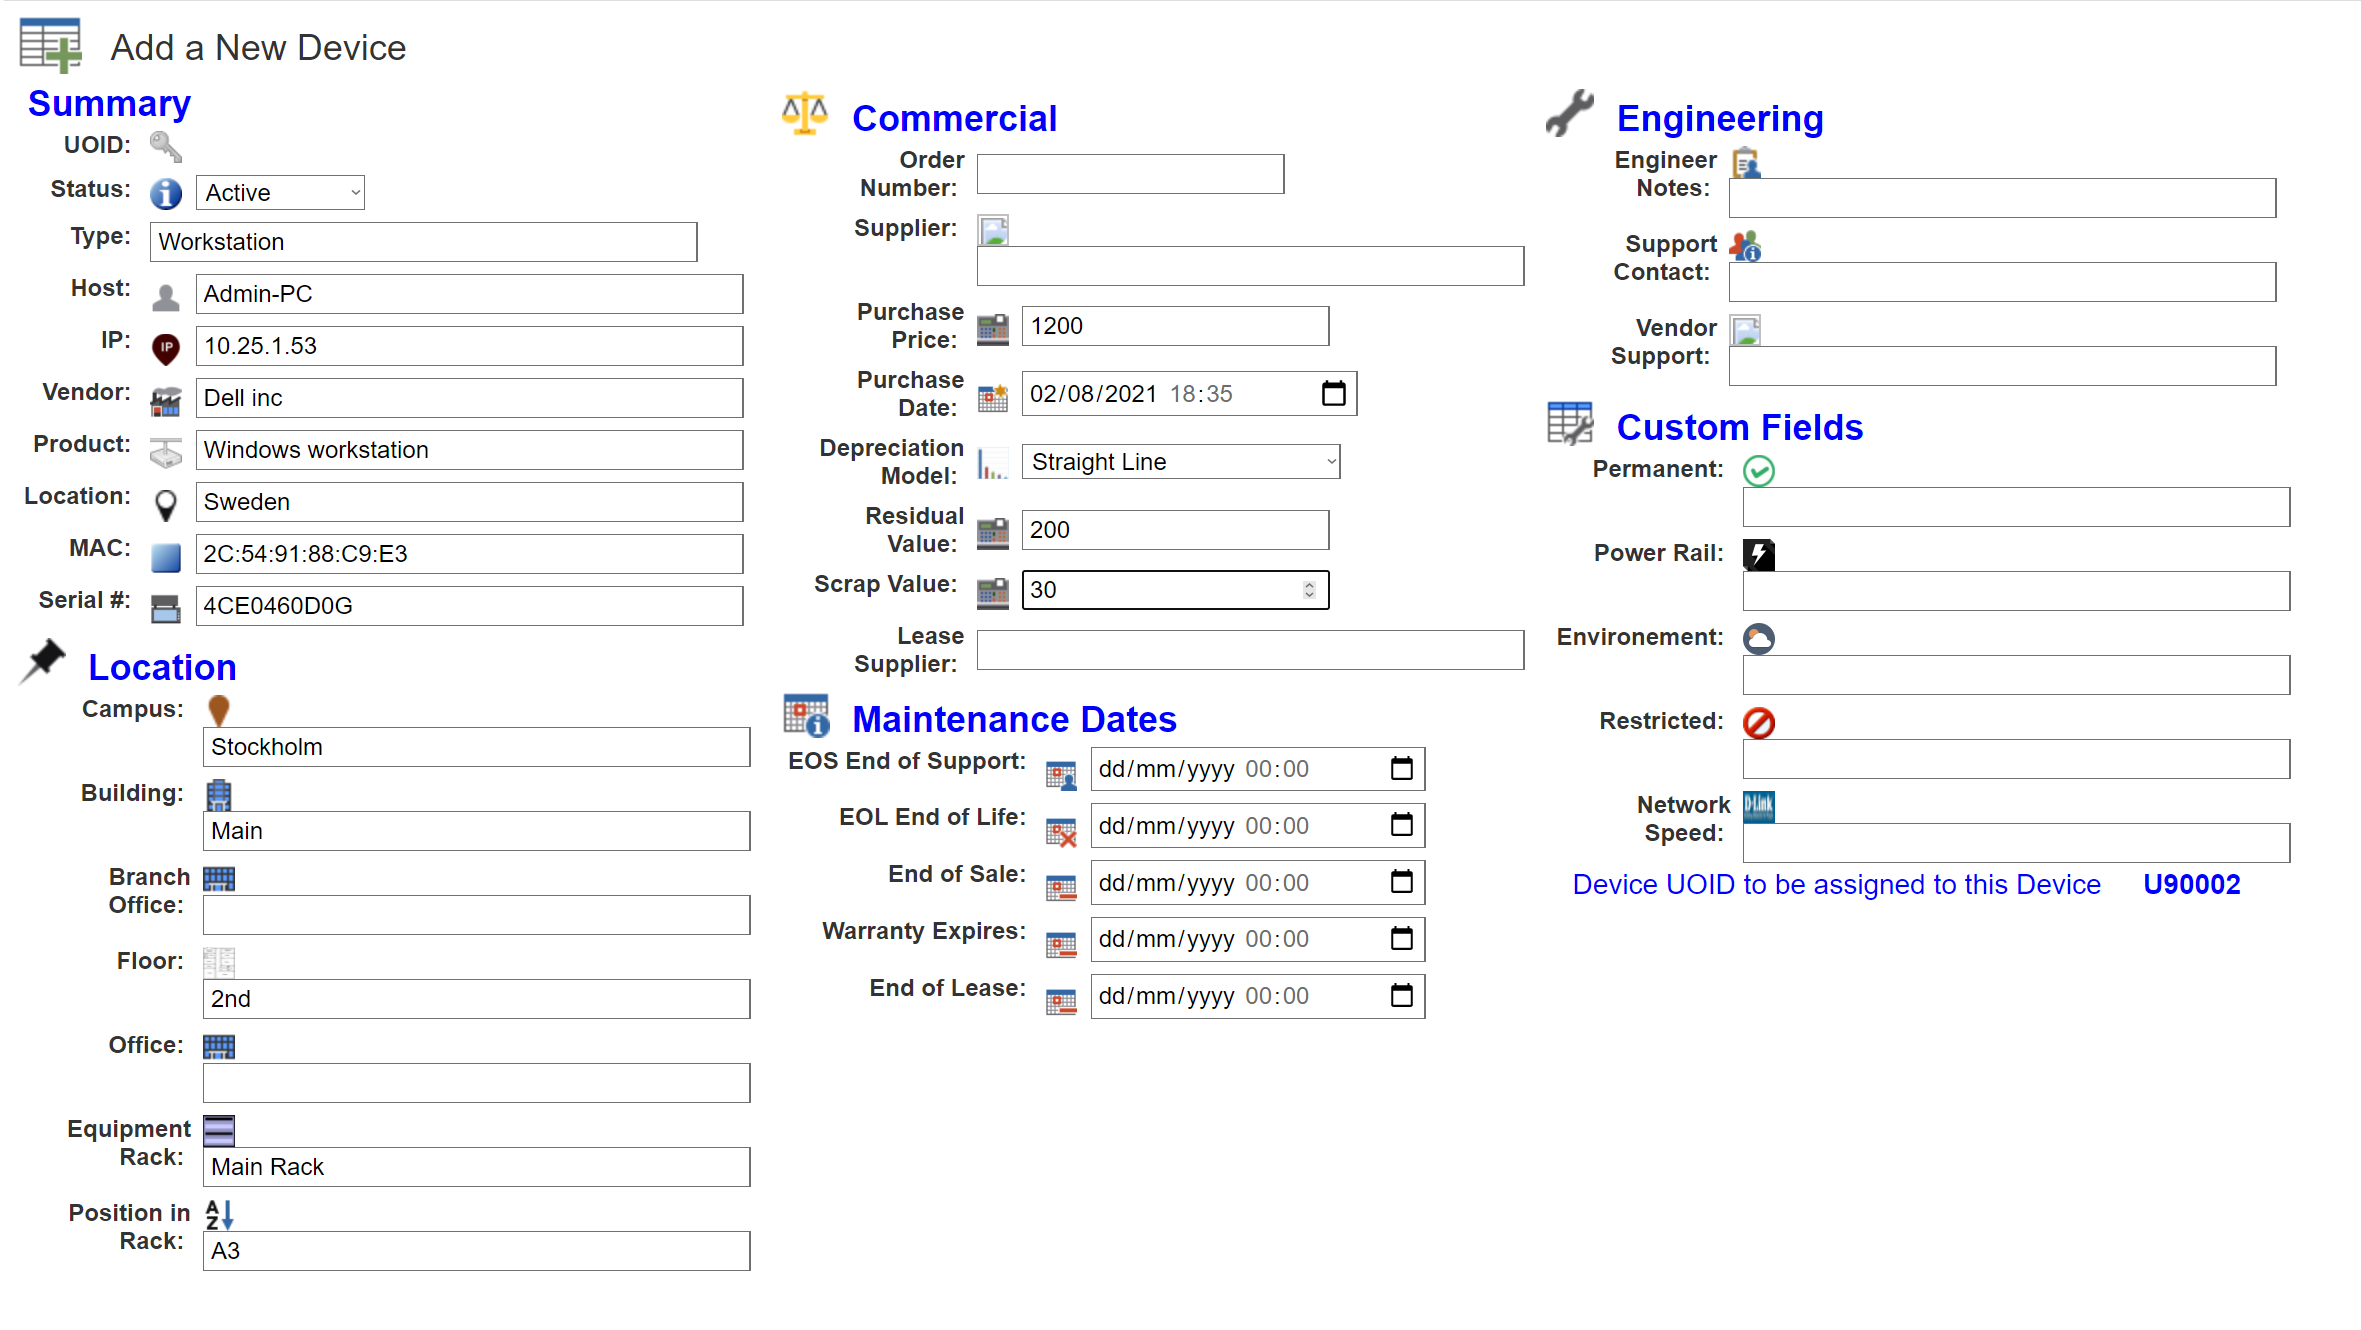
ITIL functionality allows a host of extra details to be added including adding extra devices. The Network Discovery can be scheduled and supports any number of Discoveries plus Historical Versions.