Product Overview
Support
About Us
Become a Partner
Become an Affiliate
Schedule a webinar

Automated Polling and Monitoring

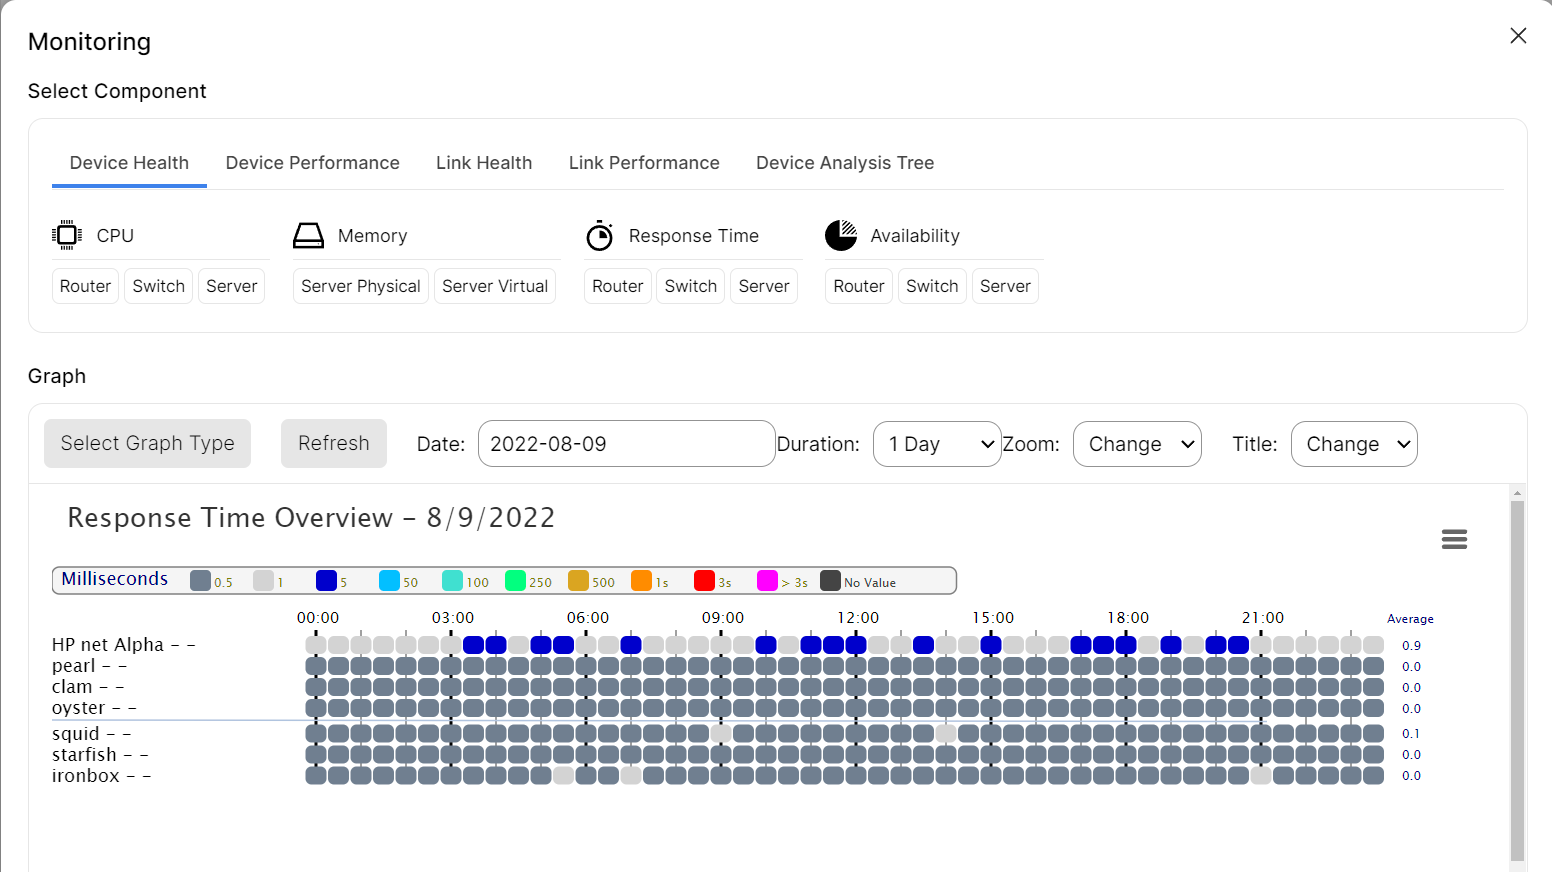
The Network Monitoring system is set up from the Web Maps menu, therefore the monitoring experience can be tailored to your needs. Both a fully automatic Adaptive Rules Based and manual Polling setup is available for maximum flexibility and scalability. The Network Monitoring engines are highly scalable using full multithreading and staggered polling throughout the system to facilitate polling large networks.

Setup Monitoring

Setting up monitoring through Toolbox is as simple as selecting a map containing the devices on your network that you wish to monitor, then with the press of a button monitored data will be presented. Toolbox offers a few methods of displaying monitoring information, including a health menu that quickly lets you determine the overall performance of a Network.

What is SNMP?

Simple Network Management Protocol (SNMP) is a way for different devices on a network to share information with one another. SNMP allows network management tools, such as Toolbox, to identify devices, monitor network performance, keep track of changes to the network, or determine the status of network devices in real time.

Advantages of Toolbox’s SNMP Monitoring

Benefits of SNMP monitoring

Manual Polling

The sources Toolbox gathers information from includes Windows Logs, SMNP, and external Syslog, which allows a user to define their own custom alert parameters. Once a device is detected to meet the specified alert parameter a notification will appear in the Web Map, and can also be set to send an email notification.

Toolbox monitors using the following sensors

Traffic

With Toolbox’s Traffic monitoring you will receive a detailed look into how much data traffic is flowing through each port of managed devices. The rates at which packets are dropped or return errors are also recorded.

CPU Load

CPU load monitoring gives you the CPU utilization percentage of all SNMP enabled devices across a network.

Memory Usage

Toolbox provides data on how much of your server’s memory is in use at any given moment. Combining this information with Toolbox health charts allows a user to determine whether an upgrade is required to keep all systems running at peak performance.

Response Time

Toolbox displays the amount of time that devices take to respond to requests over the network.

Availability

Availability reports show users what percentage of time that network devices are operational.
Codima Tech