The Maps feature is only available with the following licenses:
– Free License
– Network Inventory with Maps in Web and Visio Toolbox
– Network Inventory with Maps in Web and Visio and Monitoring + Alert Ticketing Toolbox
Toolbox Map
A straightforward Interface that allows all functions from one GUI, this allows direct mixing of all edit, display, and animation features. Maps are created automatically by doing a Network Discovery.
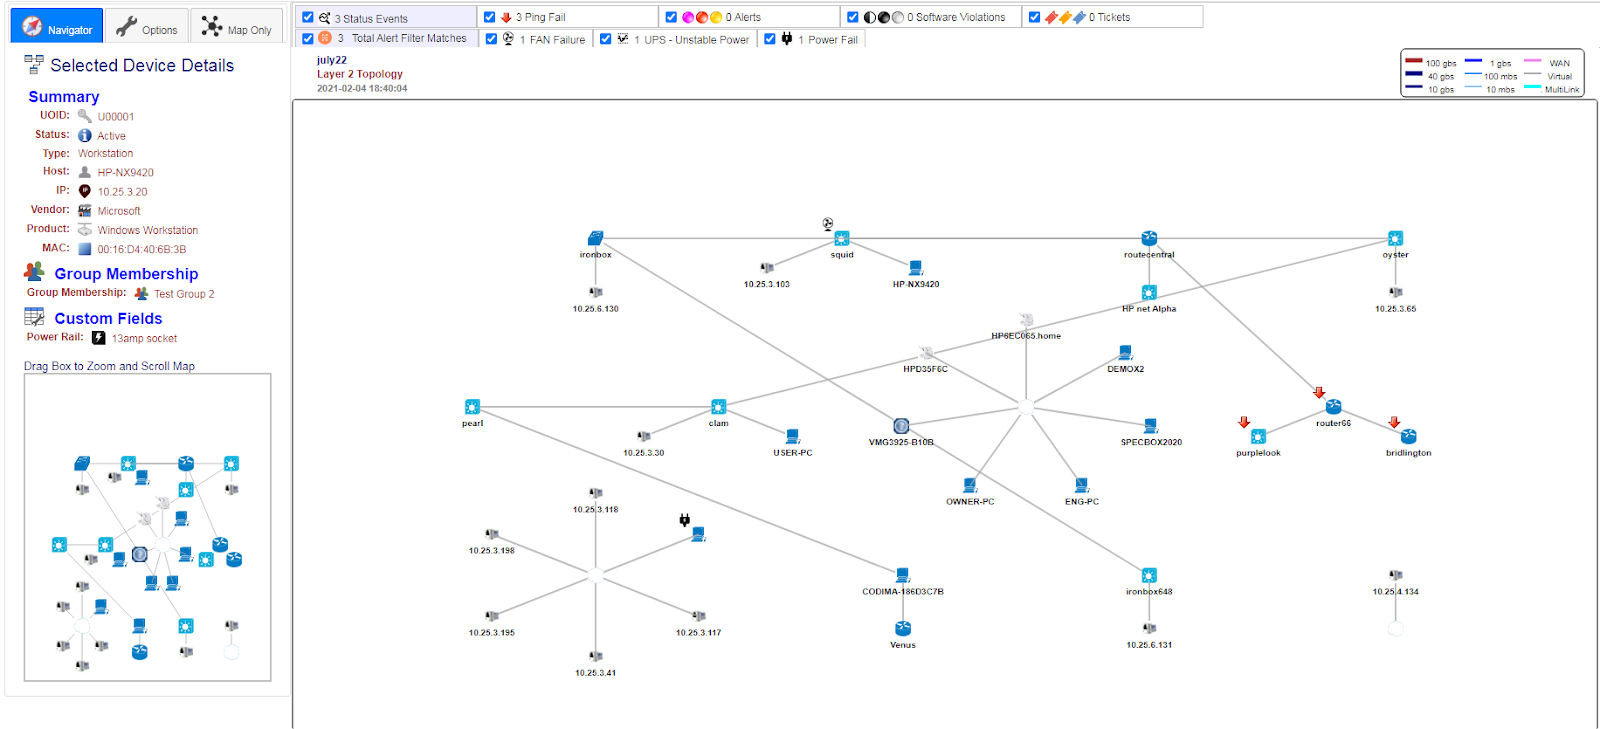
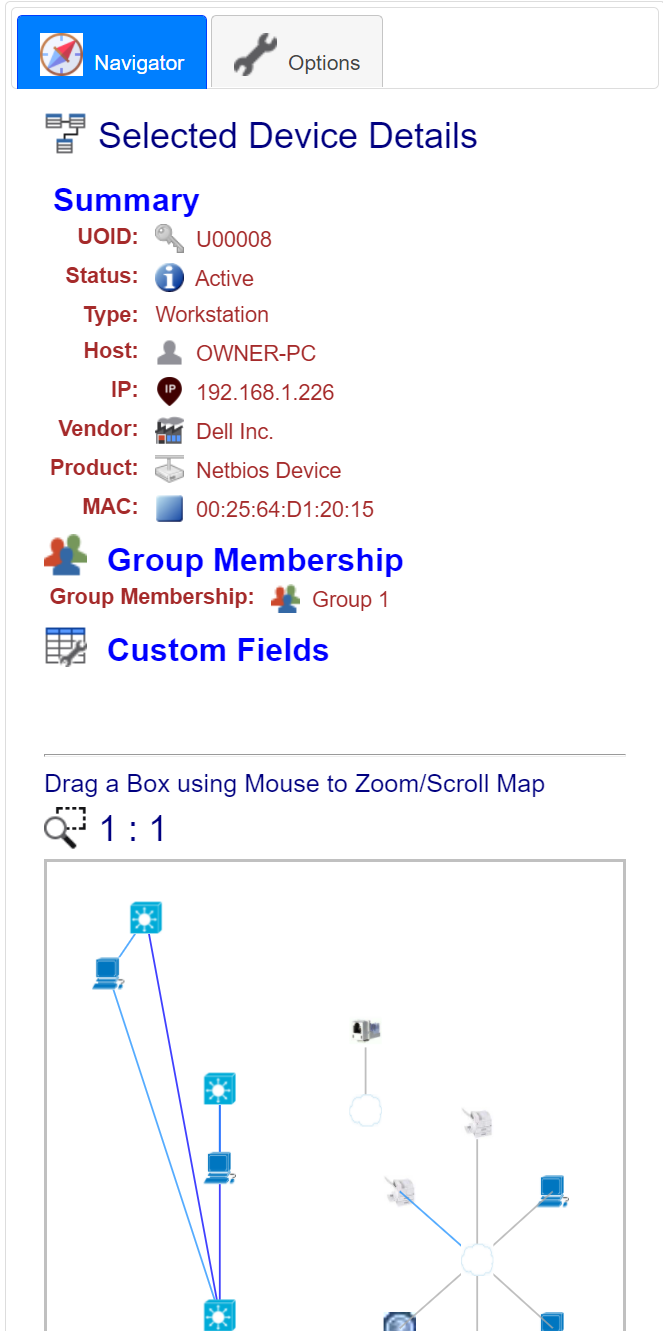
Shown below is a Map with the Navigator tab selected.
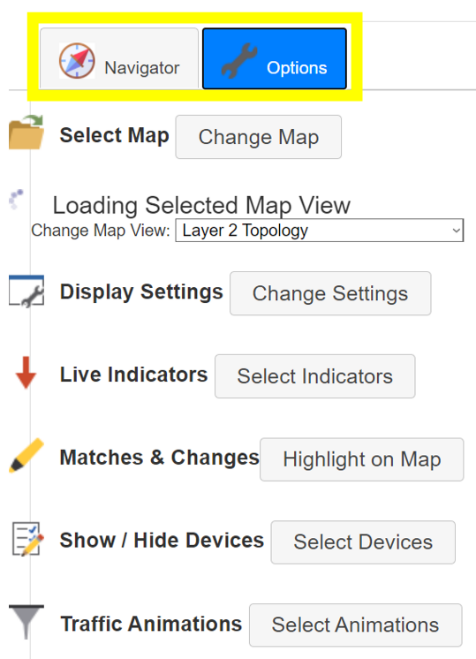
Note that there are two tabs, Navigator and Options, shown when viewing a web map using the Maps Tab.
Above the Map Options tab has been selected and is showing the Options panel, which allows maps to be selected using the Change Map button. A range of facilities to control how the Map is displayed can also be selected here.
The Navigator Tab shows two things – Firstly details on a user selected device on the Map, A device is selected by holding Shift and double clicking a device on the map. Secondly a Mini-Map to scroll and zoom the main map, to do this click and drag a box on the Mini-Map.
Map Creation
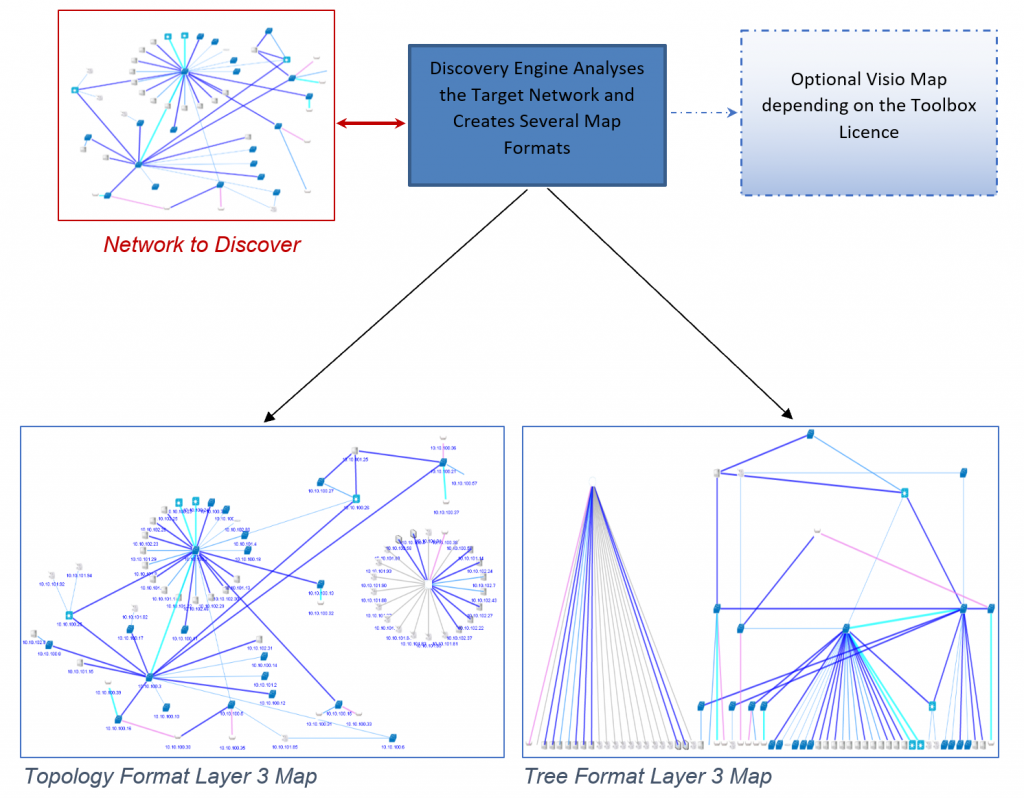
Maps are created automatically by doing a Network Discovery. Maps are produced in both a Topology format, and a Tree format as shown below. These maps are restricted to showing Layer 3 devices. Layer 2 Maps typically show many more devices. The Mapping feature is integrated with, and boosted by Live Animation, Distributed Live Maps and Drill Downs to Monitoring and Netflow.
With these maps you are able to view Live or Historic Replay of monitored traffic patterns and events. Device loading like CPU, Interface Loading and Errors, Alerts of All Kinds and can be all Animated at the same time.
A Microsoft Visio Map can also be created if that suits your needs better than the Web Maps.
Managing Maps
Selecting a Map to View
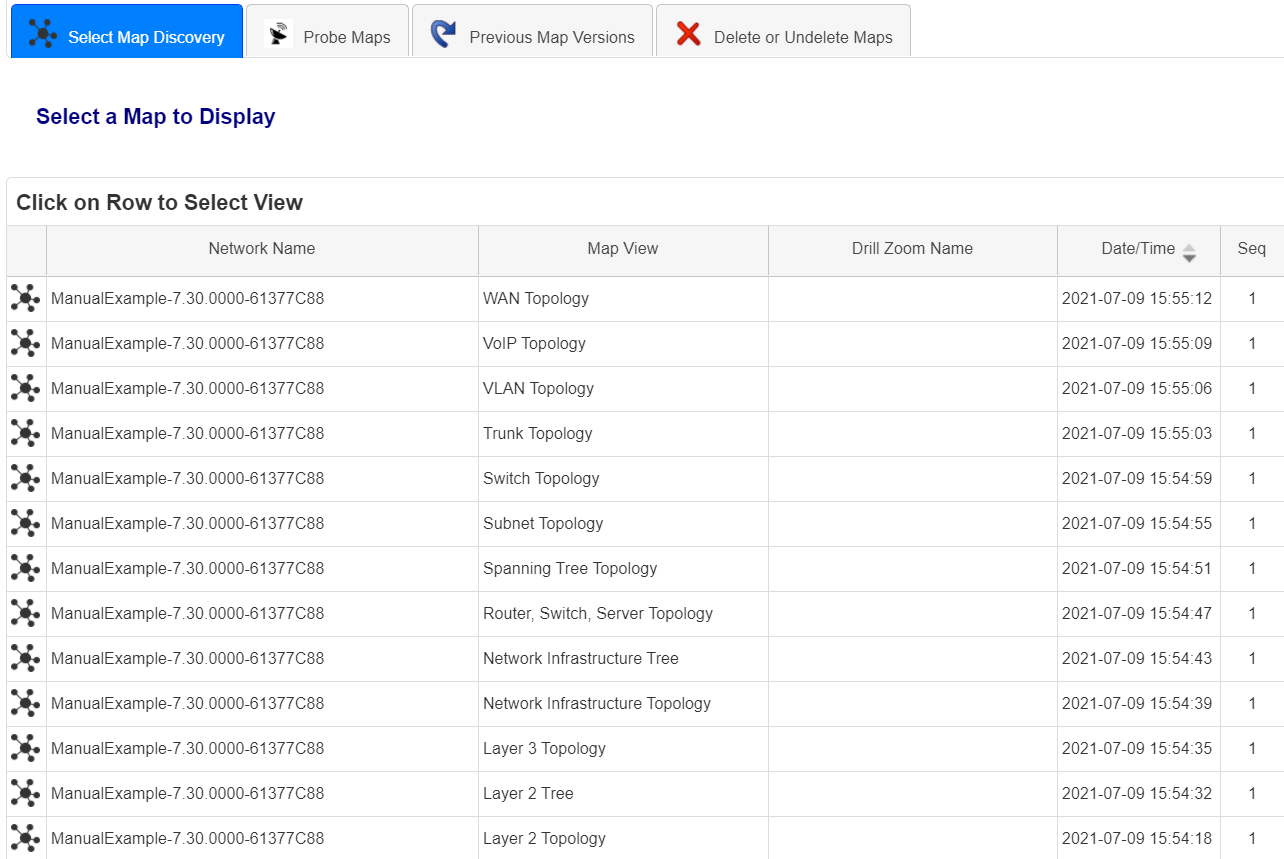
After Network Discovery click on the Maps Tab and a Pop-Up will be automatically launched. A list of map views will be visible, these have all been created automatically in conjunction with the discovery.
To view a map, just click on the desired Map View
Selecting Other Versions of the Map View
Toolbox automatically catalogues previous versions of Map Views when a Map View is Saved.
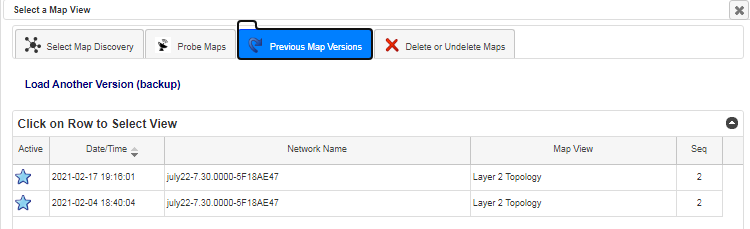
Select the Previous Map Versions tab to quickly select another version of the currently loaded map.
A blue star indicates which Map View version is current.
Click on a row to make that Map View the Current Version – this will also make this version current in Dashboard maps.
Note: You must select a Map under Select Map Discovery first to use this feature.
Simple Editing and Controlling Presentation
Devices may be freely dragged around the display, so that you can customize the map to your liking. To change device sizes, backgrounds etc, click on the Displays Setting button under the Options tab.
To save any changes that have been made to the Map, click the Save Map button that is found under the Options tab (a backup is automatically created).
Deleting and Un-Deleting Maps
Maps can be Deleted and Hidden from the Toolbox GUI, however they are kept permanently on the Toolbox Map Views DBase and can be un-deleted at any time.
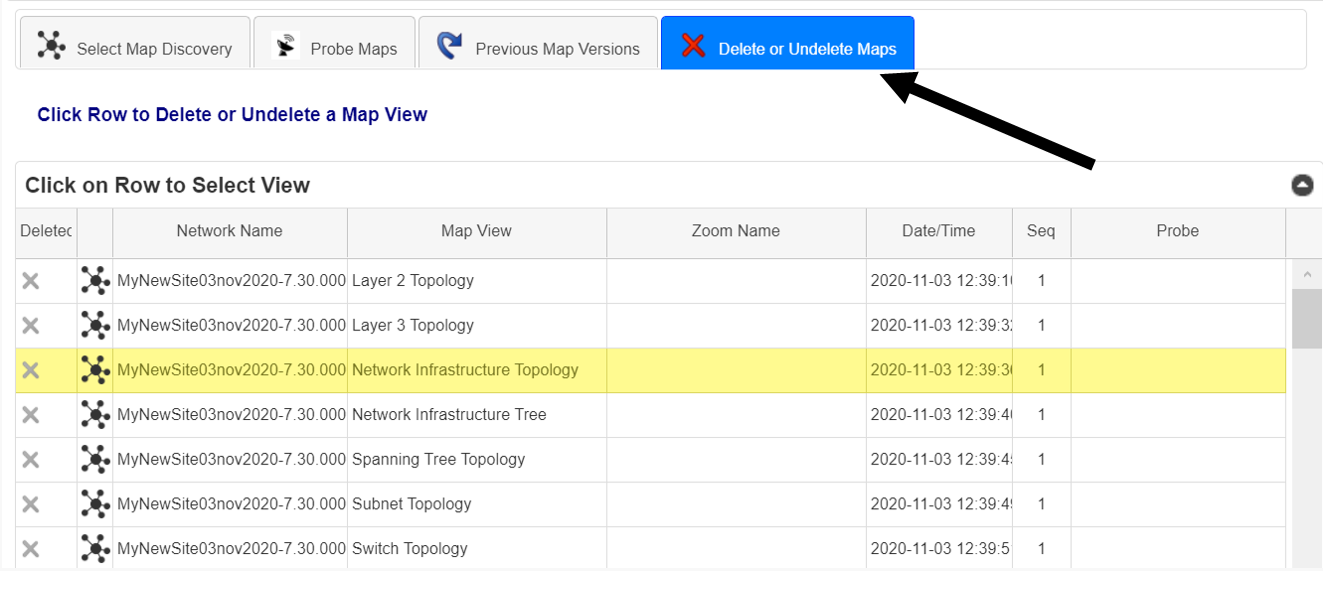
Select the Delete or Undelete Maps tab, then click on a Map View row to swap between Deleted <-> Undeleted status.
Compare Historical Maps
It is a frequent requirement to want to see changes in a map between Historical Discoveries. Compare Historical Maps shows extra, and missing devices between Discovery Histories graphically on the maps.
To view changes from Discovery Histories, firstly click the Highlight on Map button found under the Options tab:
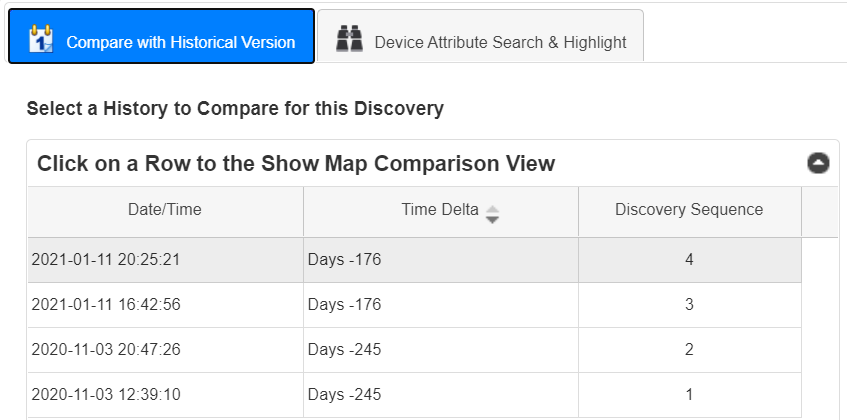
A window will appear asking you to select a previous version of the Discovery to compare with, click on the desired one:
New devices will now be highlighted with a dotted ring like this:
Devices that have been removed since the selected Discovery are listed above the Map view, like this:
Device Attribute Search & Highlight
The Device Attribute Search and highlight function has advanced search options like true wild cards and REGEX. There are three independent highlights offered to show different match classes on the same map.
To access the Device Attribute Search & Highlight follow the steps below:
First, click the Matches & Changes button found in the Maps panel under the Options tab:
Next switch over to the Device Attribute Search & Highlight tab
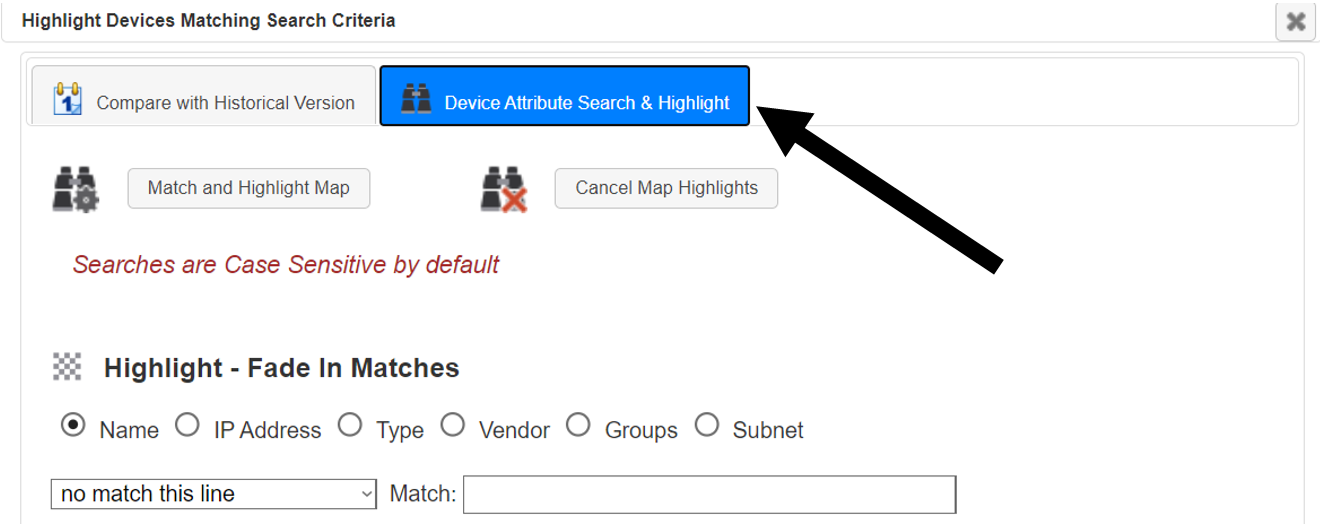
As seen below multiple searches can be set up at the same time:
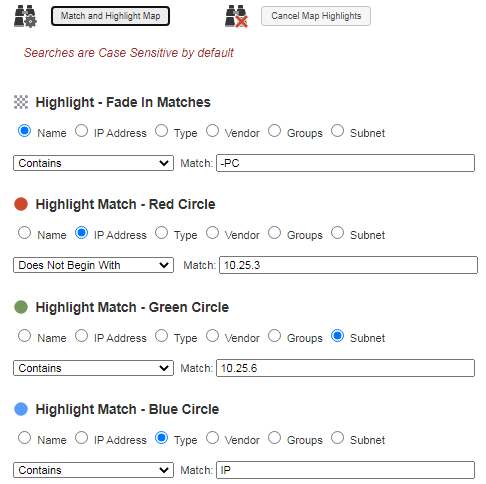
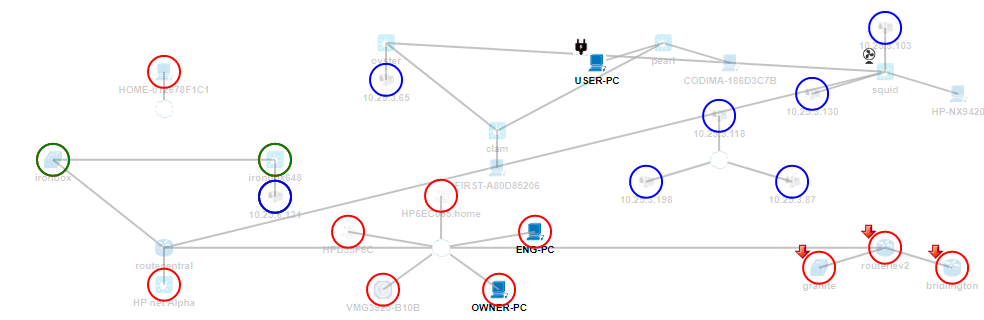
In the example map below, only devices Containing ‘-PC’ are not faded out.
Devices not in IP prefix `10.25.3’ are circled red.
Devices in Subnet ‘10.25.6’ are circled green.
Devices Type ‘IP’ are circled blue.
Live Indicators
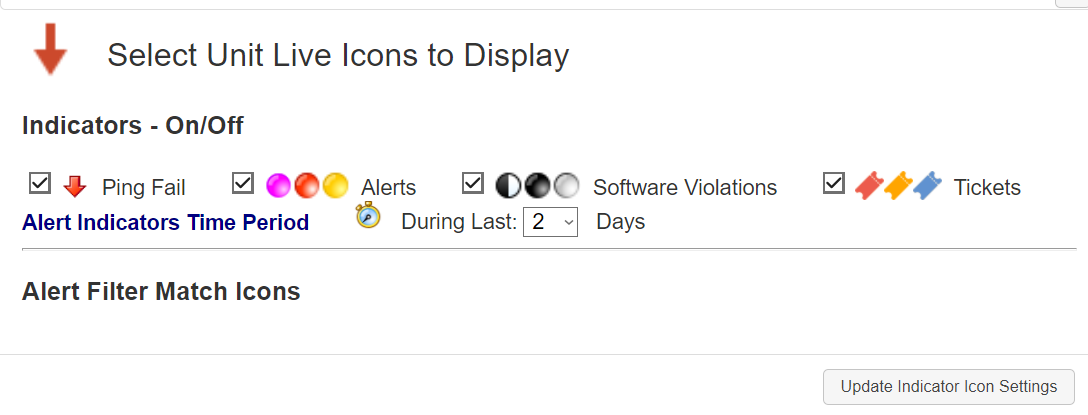
Click on the Live Indicators button, found under the Options tab, to view a popup that allows live monitoring of Down Devices, Alerts, Software Violations, and Job Tickets.
Indicators can be turned on and off and the settings will be saved with Map Save. So, specialist Maps can be created just showing Job Tickets for example.
Drill Downs – Network Device
Double clicking on a Network Device links to a comprehensive analysis of the device on Traffic, Alerts, Tickets, and an SNMP browser.
Instant Drill to the Navigator panel is selected if SHIFT Double click is done over a device in the map.
Drill Down – Inter-Device Link
Double clicking on a Link in the Network Map gives a traffic analysis and the ability to switch Monitoring On/Off.
Map Display Settings
The Map Display Settings allow you to customize the appearance of the network map to your liking.
To access the Map Display Settings, click the Display Settings button found under the Options tab.
A window will now appear with several setting that alter the maps appearance, an explanation of each setting can be found below:
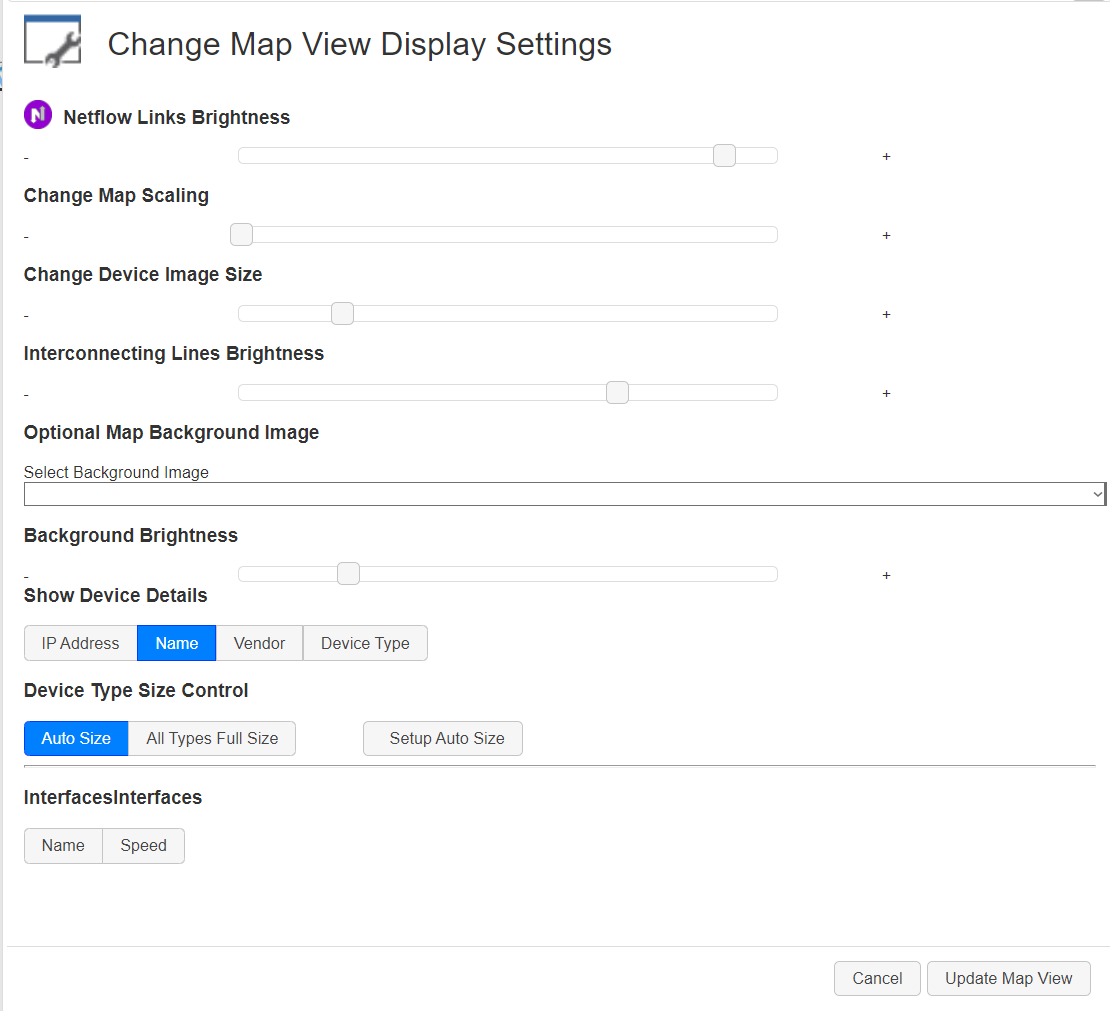
Change Map Scaling – Use this slider to change total size of the Map View. The map will attach scroll bars if the map no longer fits in the display area.
Change Device Image Size – The Map Devices will shrink or expand and the associated Indicators like Ping Down will also try to follow the Device scaling (within practical limits).
Interconnecting Lines Brightness – use this slider to fade out or intensify the Lines between Devices.
Optional Map Background Image – the user has an option to select an image as a map background see How to Add my own Map Background
Background Brightness – The slider allows the user to fade or brighten the selected map background.
Show Device Details – Select what information to show under each device.
Using Alert Filters to show Filter Matched Alerts in the Map
The system accepts Alerts from many internal sources such as Ping Fails, CPU overloads, Link Errors created by the Toolbox monitoring engine.
NetFlow violations such as Security breaches detected by NetFlow Analytics module such as DDoS attacks or Blacklisted IPs such as Botnet controller IP matches, or DNS or other server types, Spoofing attacks.
Additionally, external Alerts can be directed to Toolbox via Syslog or SNMP TRAPs from network devices which give device status changes like a Fan Failure, plus security information from Firewalls.
Windows logs can be tracked in Toolbox, which provide information on configuration and Security events that are converted by Toolbox into Alerts that can also be matched and displayed on the Web Maps.
These incoming Alerts are processed by the Toolbox Alerts and Ticketing System and matches are tracked per network device. This tracking information is presented in the Toolbox Map. There can be any number of Alert Filters, so the Toolbox Map interface has been heavily revised to display and control the new Alert Matcher information.
The Alert Matchers are also used to create Job Tickets which is still fully functional.
The Filter Alerts can be a very extensive list as an unlimited list of filters can be created.
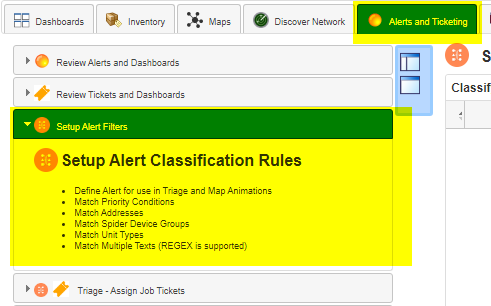
The filters are created under the Alerts and Ticketing Tab as below: –
Setting Up Alert Filters
Click on the Setup Filters panel as below:
Click on the Add New Filter button to add a new Alert Filter.
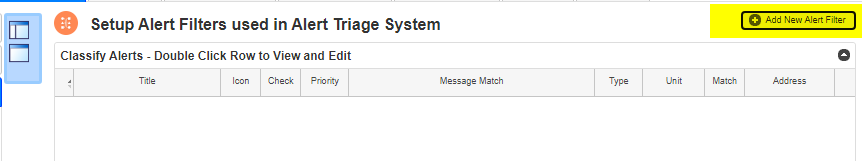
A dialog box appears allowing very detailed Alert Matching options: –
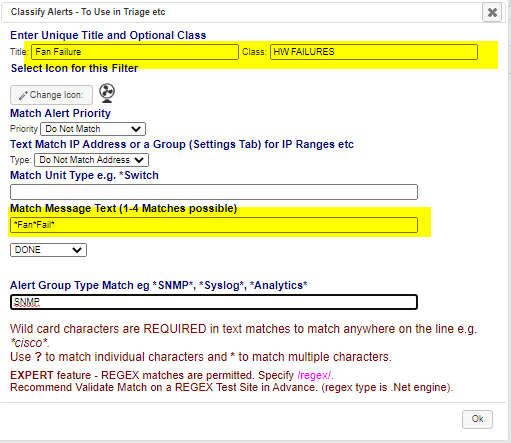
Any number of matchers may be added. For Map usage it is important to select an Icon using the Change Icon button.
After an Alert Filter is setup, the system will track each alert match per network device.
Showing Filtered Alerts on the Map
Matched filters will appear on the Network map as below represented by the Alert Filter ICON
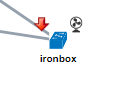
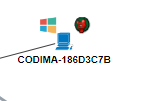
Two devices are shown above, device ironbox shows a link down and a fan failure. The device named Codima-186D3C7B, shows a Windows Event match plus a Netflow detected Worm. Toolbox supports Windows Event Log Retrieval and also NetFlow Analytics to detect blacklisted sites etc.
The Map GUI gives direct control over which Icons are displayed. Below is the standard Icons that show Toolbox monitoring status. Clicking the Status Events tick box turns all status events on or off. Clicking on individual tick boxes, such as Ping Fail, switches only that Status on or off.

Alert Filter matches can also be selectively shown on the Map.

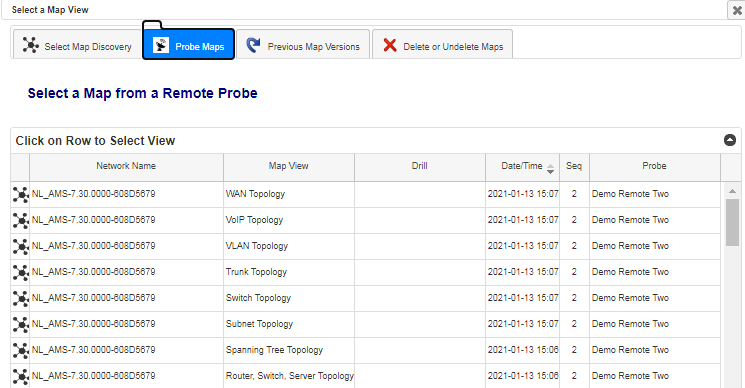
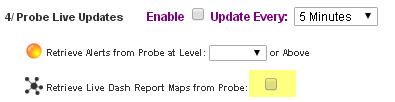
Viewing Probe Maps
Under the Main GUI Settings tab Probe Maps tab, Map Views can be viewed from Remote Probes.
Note: Probe maps are automatically retrieved from the Probes if requested under the Probe settings setup popup. To change auto-Map retrieval, under Settings tab, panel Probes are selected and a Probe Grid row is clicked. The popup below will appear, tick box highlighted in yellow in the screen shot below.
What do Animations Do?
A probably unique feature of Toolbox is to be able to show both Live and Replayed Animations of Network Events on the Topology maps, including in the Dashboards Maps from Multiple Probes at the same time.
This gives the capability to see for example a DDoS Attack detected by Toolbox Netflow Analytics against Link Loadings from SNMP and CPU Utilization on the Servers – also with Filtered Alert Animations. (For NetFlow contact product support for further details)
For example, one can see running Software with Black/White Rules against Highly Filtered Netflow Traffic matching Known Virus Attacks detected by Netflow on any number of Probes in a single Dashboard Report. For Netflow support please contact local support.
Animation Control
Traffic and System metrics can be replayed to check network conditions historically. The monitored devices CPU loading can also be replayed. Link colouring for monitored inter-device links shows traffic levels or error levels like dropped packets.
Overview and Replay Animations
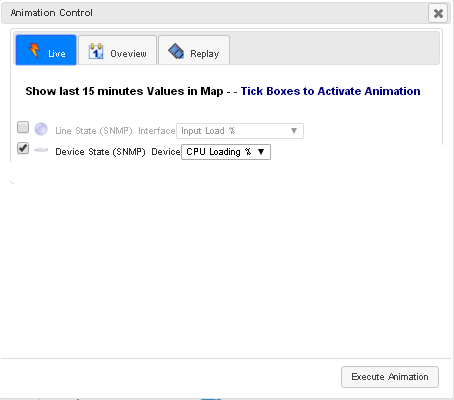
There are 3 different Animation Modes, Live, which shows the current measured values, Overview, which Shows a Day Summary – good for quickly assessing where to look and Replay historical patterns with full video recorder type controls.
Overview mode is shown below:
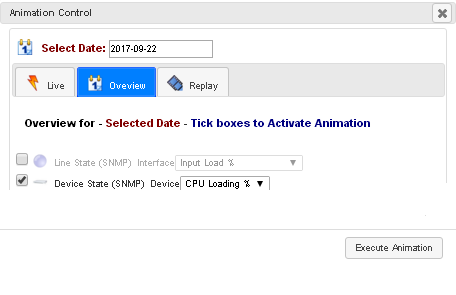
To activate this mode simply set the Select Date: calendar control and click on the Execute Animation button.
Replay Mode is shown below:
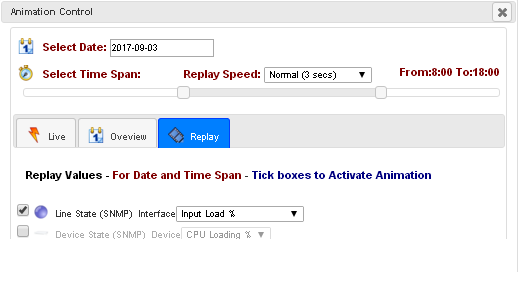
First select the date from the Calendar control Select Date:
Next use the slider control Select Time Span to drag the two handles to the required time span, for instance around the time an incident was known to occur.
Then choose a Replay Speed using the dropdown control. This can be used to quickly run through an animation, or it can be done in slow motion instead.
Click on the Execute Animation button to start the animation processing.
Below is an example of Animations on a Web Map.
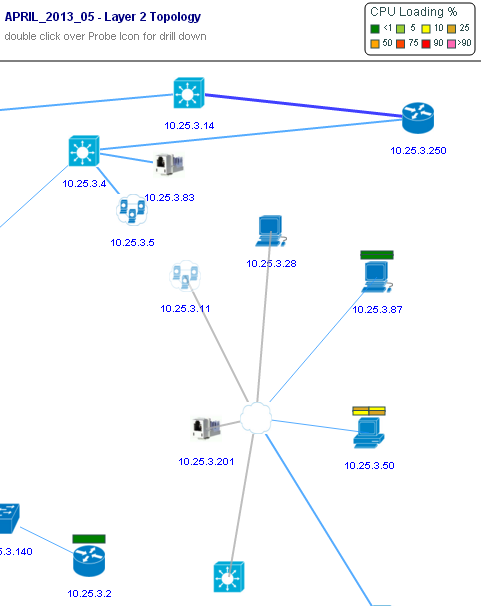
A single bar denotes a single CPU for 10.25.3.2, double bar shows there are 2 CPUs for 10.25.3.87 and 4 CPUs for 10.25.3.50. Note the Color Key box in the top right, this decodes the bar colours into \% Loadings. In the case of 10.25.3.2 loading is less than 1\%, in the case 10.25.3.50 loadings 10-25\% for the 4 CPUs.
Below we have selected Replay Animation mode, this allows the user to replay on a chosen date:
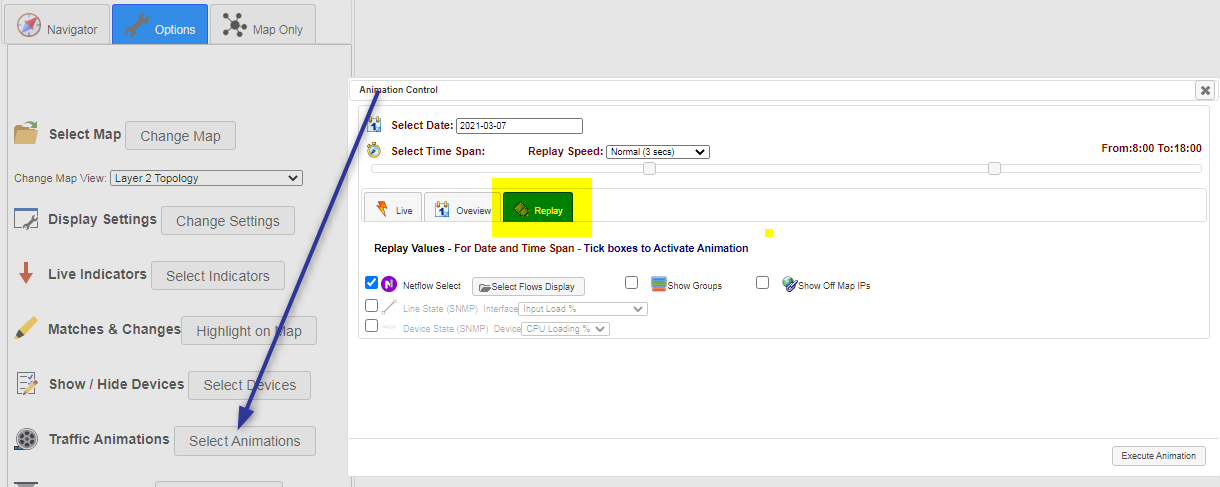
When Animation is selected in the dialog above then a bar appears across the top of the map:

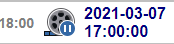
The controls to play forward in time, pause the animations and go backwards in time, are highlighted in yellow.
The green highlight is the time progress bar, it shows the current animation time and can also be used to drag the animation time to a new time by dragging the handle using a mouse. The arrow points to the mouse drag handle.

The current animation time is shown in the blue highlighted section below. The icon shows the selected mode; going forward, paused or going backwards in time.
How to Add my own Map Background
The Map Backgrounds are stored in a special folder in the Web Server Directory under Program Files see below:-
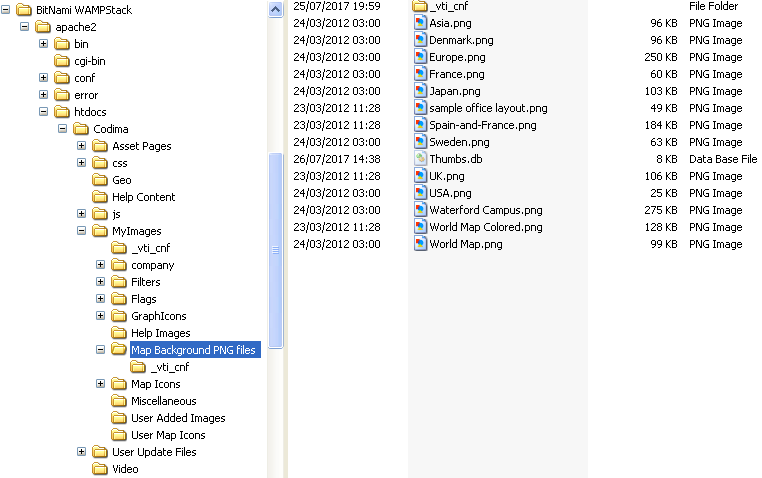
After adding new Map Backgrounds, refresh the Toolbox Web Page to load the new Map Background images.
Around 80 Background Web Maps are available for use in Inventory Explorer Views and as backgrounds for the Web Maps.
They will then appear in the Select Map Background dropdown list in the Change Map View Display dialog box (after clicking display options icon on LHS icon list in the map view).